empty
07.04.2023 12:06 AM
Technical analysis of EUR/USD for April 06, 2023

This image is no longer relevant

Overview :

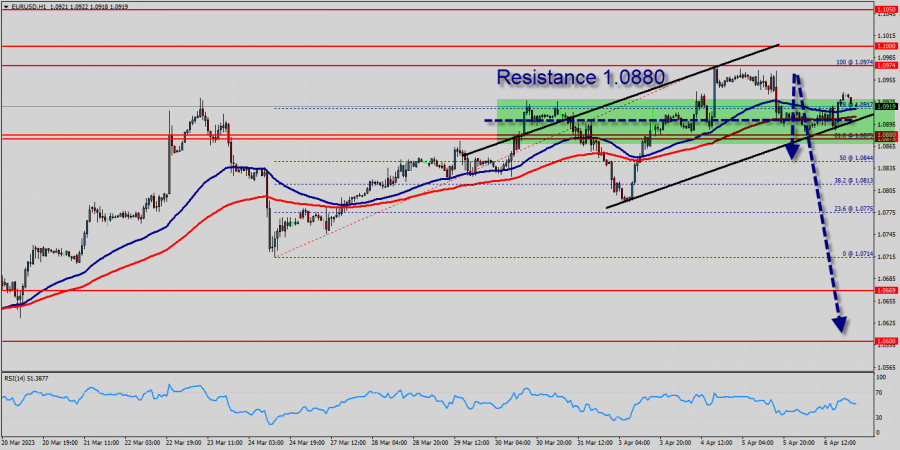
Since last week, the EUR/USD pair has faced strong resistances at the levels of 1.0880 because support had become resistance last week. So, the strong resistance has been already formed at the level of 1.0880 and the pair is likely to try to approach it in order to test it again. However, if the pair fails to pass through the level of 1.0880, the market will indicate a bearish opportunity below the new strong resistance level of 1.0880 (the level of 1.0880 coincides with a ratio of 61.8% Fibonacci - last bullish wave - double top).

Moreover, the RSI starts signaling a downward trend, as the trend is still showing strength above the moving average (100) and (50). The trend of EUR/USD pair movement was controversial as it took place in the downtrend channel. Due to the previous events, the price is still set between the levels of 1.0808 and 1.0669, so it is recommended to be careful while making deals in these levels because the prices of 1.0808 and 1.0669 are representing the resistance and support respectively.

It is necessary to wait till the downtrend channel is passed through. Then the market will probably show the signs of a bearish market. It should be noted that the volatility is very high for that the price of the EUR/USD pair is still trading between the prices of 1.0669 and 1.0808 in the coming hours. Furthermore, the price has been set below the strong resistance at the levels of 1.0808 and 1.0851 which coincide with the ratios of Fibonacci retracement levels respectively. Thus, the market is indicating a bearish opportunity below 1.0880 so it will be good to sell at 1.0808 with the first target of 1.0669.

It will also call for a downtrend in order to continue towards 1.0630. The daily strong support is seen at 1.0600. However, the stop loss should always be taken into account, for that it will be reasonable to set your stop loss at the level of 1.0851. Moving averages, in the meantime, maintain their bearish slope way above the current level.

Furthermore, although the news is bearish for the EUR/USD pair, professional may not want to sell weakness, but rather following a rebound rally. Additionally, some aggressive counter-trend buyers may be defending parity. In case a continuisions takes place and the EUR/USD pair breaks through the support level of 1.0669, a further decline to 1.0600 can occur which would indicate a bearish market.

The EUR/USD pair didn't make any significant movements yesterday. There are no changes in our technical outlook. The bias remains bearish in the nearest term testing 1.0669 or lower. Immediate support is seen around 1.0669. A clear break below that area could lead price to the neutral zone in the nearest term. Price will test 1.06030, because in general, we remain bearish on between Feb 13rd and Feb 18th, 2023. The market moved from its bottom at 1.0669 and continued to rise towards the top of 1.0680. Today, on the one-hour chart, the current rise will remain within a framework of correction.

This image is no longer relevant

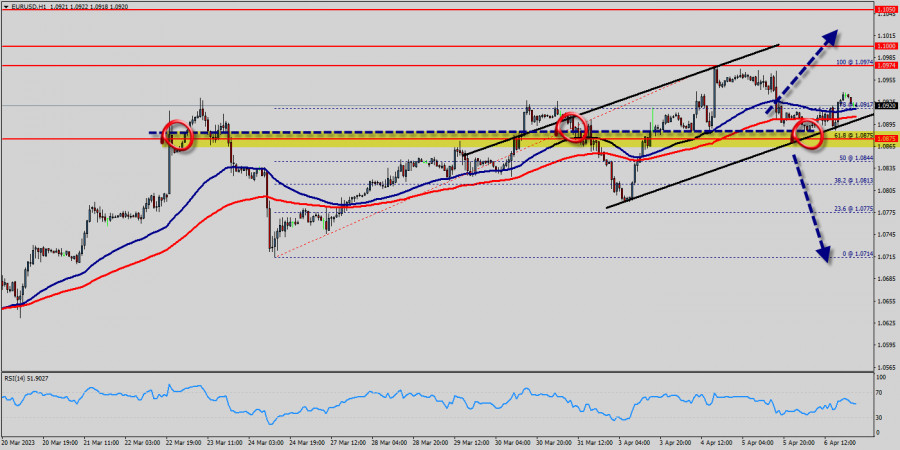
However, if the pair fails to pass through the level of 1.0732 (major resistance), the market will indicate a bearish opportunity below the strong resistance level of 1.0669 (the level of 1.0669 coincides with the ratio of 00% Fibonacci retracement - last bearish wave). This resistance has been rejected several times confirming the downtrend. Additionally, the RSI starts signaling a downward trend.

The trend is still below the 100 EMA for that the bearish outlook remains the same as long as the 100 EMA is headed to the downside. Since there is nothing new in this market, it is not bullish yet. Sell deals are recommended below the level of 1.0669 with the first target at 1.0630 so as to test the double bottom. If the trend breaks the double bottom level of 1.0600, the pair is likely to move downwards continuing the development of a bearish trend to the level of 1.0600 in order to test the weekly support 2. The third weekly support is set at the price of 1.0543.

Chọn khung thời gian
5
phút
15
phút
30
phút
1
giờ
4
ngày
1
ngày
1
tuần
Kiếm lợi nhuận từ những biến đổi giá của tiền điện tử với InstaForex.
Tải MetaTrader 4 và mở giao dịch đầu tiên của bạn.
  • Grand Choice
    Contest by
    InstaForex
    InstaForex always strives to help you
    fulfill your biggest dreams.
    THAM GIA CUỘC THI

Các bài báo được đề xuất

EUR/USD và GBP/USD – Phân Tích Kỹ Thuật cho ngày 9 tháng 4

Các nhà đầu cơ giá lên đang cố gắng giành lại quyền kiểm soát và hiện tại chúng tôi đang quan sát thấy hoạt động gia tăng cùng

Evangelos Poulakis 10:07 2025-04-09 UTC+2

Phân Tích Kỹ Thuật Về Sự Biến Động Giá Nội Ngày Của Công Cụ Hàng Hóa Khí Tự Nhiên, Thứ Tư, Ngày 09 Tháng 04 Năm 2025.

Trên biểu đồ 4 giờ của công cụ hàng hóa Natural Gas, mô hình Bearish 123 xuất hiện tiếp theo là Bearish Ross Hook (RH), sau đó là diễn biến

Arief Makmur 07:11 2025-04-09 UTC+2

Phân Tích Kỹ Thuật Sự Biến Động Giá Trong Ngày Của Cặp Tiền Tệ Hàng Hóa USD/CAD, Thứ Tư, Ngày 09 Tháng 4, 2025.

Mặc dù trên biểu đồ 4 giờ, cặp tiền tệ hàng hóa USD/CAD đang di chuyển trong kênh Bearish, nhưng với sự hình thành của mô hình Bullish

Arief Makmur 07:11 2025-04-09 UTC+2

Dự báo EUR/USD cho ngày 9 tháng 4 năm 2025

Đến cuối ngày thứ Ba, đồng euro đã tăng 45 điểm, và trong phiên giao dịch Thái Bình Dương hôm nay, nó đã thêm được một khoảng tương tự, tiến

Laurie Bailey 04:31 2025-04-09 UTC+2

Dự báo GBP/USD cho ngày 9 tháng 4 năm 2025

Vào thứ Ba, đồng bảng Anh đã thử nghiệm biên dưới của phạm vi mục tiêu tại 1.2816/47 với bóng nến phía trên. Sáng

Laurie Bailey 04:31 2025-04-09 UTC+2

Dự báo AUD/USD cho ngày 9 tháng 4 năm 2025

Nỗ lực tăng giá của đồng đô la Úc vào thứ Hai và thứ Ba hướng tới mức mục tiêu 0.6133 đã bị ngăn chặn (như được chỉ định

Laurie Bailey 04:31 2025-04-09 UTC+2

Tín hiệu giao dịch cho VÀNG (XAU/USD) từ ngày 8-10 tháng 4, 2025: mua trên $2,993 (200 EMA - bật lên)

Kế hoạch giao dịch của chúng tôi trong những giờ tới là bán vàng dưới mức 3,020, vì theo phân tích kỹ thuật có một kênh xu hướng giảm

Dimitrios Zappas 14:56 2025-04-08 UTC+2

Tín hiệu giao dịch cho EUR/USD từ ngày 8-10 tháng 4, 2025: bán khi dưới mức 1.0986 (200 EMA - 6/8 Murray)

Nếu đồng euro phá vỡ kênh xu hướng giảm, chúng ta có thể kỳ vọng một đợt tăng giá mới có thể đẩy EUR/USD lên tới 1.1051, mức cao nhất

Dimitrios Zappas 14:54 2025-04-08 UTC+2

Dự báo tỷ giá EUR/USD vào ngày 8 tháng 4 năm 2025

Vào thứ Hai, cặp EUR/USD đã hai lần bật lên từ mức thoái lui 76.4%, nghiêng về phía euro và củng cố trên vùng 1.0944–1.0957. Kết quả là, xu hướng

Samir Klishi 10:57 2025-04-08 UTC+2

Dự báo cho GBP/USD vào ngày 8 tháng 4 năm 2025

Trên biểu đồ hàng giờ, cặp GBP/USD tiếp tục giảm vào thứ Hai và kết thúc ngày gần mức 1.2709. Chỉ trong hai ngày giao dịch, đồng bảng đã giảm

Samir Klishi 10:53 2025-04-08 UTC+2
Không thể nói chuyện ngay bây giờ?
Đặt câu hỏi của bạn trong phần trò chuyện.
Widget callback
 

Dear visitor,

Your IP address shows that you are currently located in the USA. If you are a resident of the United States, you are prohibited from using the services of InstaFintech Group including online trading, online transfers, deposit/withdrawal of funds, etc.

If you think you are seeing this message by mistake and your location is not the US, kindly proceed to the website. Otherwise, you must leave the website in order to comply with government restrictions.

Why does your IP address show your location as the USA?

  • - you are using a VPN provided by a hosting company based in the United States;
  • - your IP does not have proper WHOIS records;
  • - an error occurred in the WHOIS geolocation database.

Please confirm whether you are a US resident or not by clicking the relevant button below. If you choose the wrong option, being a US resident, you will not be able to open an account with InstaForex anyway.

We are sorry for any inconvenience caused by this message.