empty
сформирован 26.03 в 00:39:05 (UTC+0)
сила сигнала 2 из 5
Медвежий симметричный треугольник NZDJPY M15

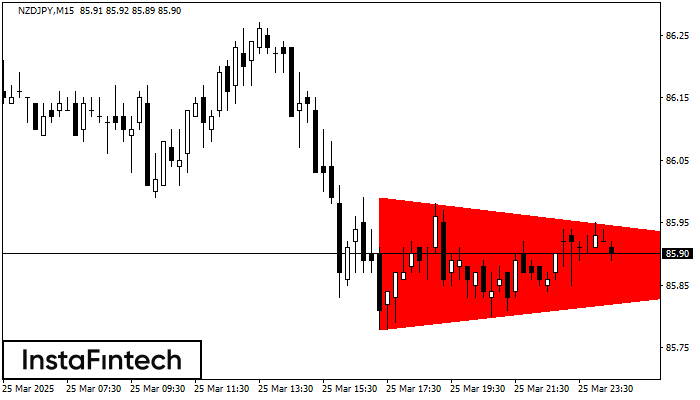
На графике NZDJPY M15 сформировалась фигура «Медвежий симметричный треугольник». Характеристика фигуры: Нижняя граница 85.78/85.88; Верхняя граница 85.99/85.88; Проекция ширины фигуры -21 пунктов. Формирование фигуры «Медвежий симметричный треугольник» наиболее вероятным образом свидетельствует о продолжении нисходящего тренда. Это означает, что курс NZDJPY, в случае срабатывания фигуры, пробьет нижнюю границу и, вероятно, проследует к 85.65.

Таймфреймы М5 и М15 могут иметь больше ложных точек входа.

Shuningdek ko'ring

Фигура
  • Все
  • Вымпел
  • Голова и плечи
  • Двойная вершина
  • Прямоугольник
  • Треугольник
  • Тройная вершина
  • Флаг
Инструмент
  • Все
  • #AAPL
  • #AMZN
  • #Bitcoin
  • #EBAY
  • #FB
  • #GOOG
  • #INTC
  • #KO
  • #MA
  • #MCD
  • #MSFT
  • #NTDOY
  • #PEP
  • #TSLA
  • #TWTR
  • AUDCAD
  • AUDCHF
  • AUDJPY
  • AUDUSD
  • EURCAD
  • EURCHF
  • EURGBP
  • EURJPY
  • EURNZD
  • EURRUB
  • EURUSD
  • GBPAUD
  • GBPCHF
  • GBPJPY
  • GBPUSD
  • GOLD
  • NZDCAD
  • NZDCHF
  • NZDJPY
  • NZDUSD
  • SILVER
  • USDCAD
  • USDCHF
  • USDJPY
  • USDRUB
Таймфрейм
  • Все
  • M5
  • M15
  • M30
  • H1
  • D1
Тренд
  • Все
  • Покупка
  • Продажа
Сила сигнала
  • Все
  • 1
  • 2
  • 3
  • 4
  • 5
Bullish Rectangle
сформирован 01.04 в 20:31:48 (UTC+0)
сила сигнала 1 из 5
Bullish Rectangle NZDCHF M5

According to the chart of M5, NZDCHF formed the Bullish Rectangle. This type of a pattern indicates a trend continuation. It consists of two levels: resistance 0.5033 and support 0.5024

The M5 and M15 time frames may have more false entry points.

Открыть график инструмента в новом окне
Triple Bottom
сформирован 01.04 в 20:26:17 (UTC+0)
сила сигнала 1 из 5
Triple Bottom AUDCAD M5

The Triple Bottom pattern has formed on the chart of the AUDCAD M5 trading instrument. The pattern signals a change in the trend from downwards to upwards in the case

The M5 and M15 time frames may have more false entry points.

Открыть график инструмента в новом окне
Double Top
сформирован 01.04 в 20:16:16 (UTC+0)
сила сигнала 2 из 5
Double Top AUDCHF M15

On the chart of AUDCHF M15 the Double Top reversal pattern has been formed. Characteristics: the upper boundary 0.5545; the lower boundary 0.5534; the width of the pattern 11 points

The M5 and M15 time frames may have more false entry points.

Открыть график инструмента в новом окне
Hozir telefon orqali gaplasha olmaysizmi?
Savolingizni bering chatda.
Обратный звонок
 

Dear visitor,

Your IP address shows that you are currently located in the USA. If you are a resident of the United States, you are prohibited from using the services of InstaFintech Group including online trading, online transfers, deposit/withdrawal of funds, etc.

If you think you are seeing this message by mistake and your location is not the US, kindly proceed to the website. Otherwise, you must leave the website in order to comply with government restrictions.

Why does your IP address show your location as the USA?

  • - you are using a VPN provided by a hosting company based in the United States;
  • - your IP does not have proper WHOIS records;
  • - an error occurred in the WHOIS geolocation database.

Please confirm whether you are a US resident or not by clicking the relevant button below. If you choose the wrong option, being a US resident, you will not be able to open an account with InstaForex anyway.

We are sorry for any inconvenience caused by this message.