сила сигнала 1 из 5
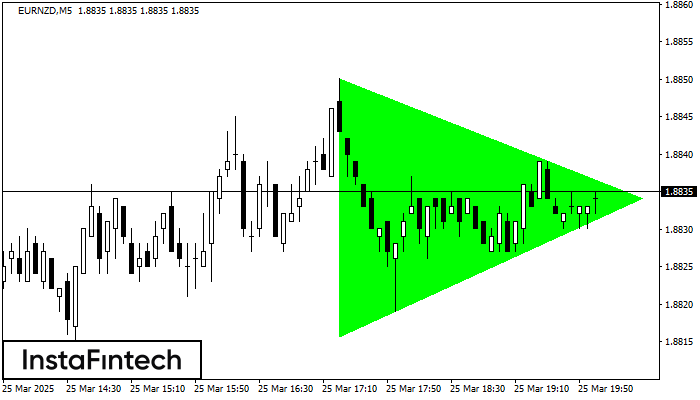
По EURNZD на M5 сформировалась фигура «Бычий симметричный треугольник», которая сигнализирует нам о продолжении тенденции. Характеристика: Верхняя граница фигуры имеет координаты 1.8850/1.8834; Нижняя граница 1.8816/1.8834; Проекция ширины фигуры 34 пунктов. Формирование фигуры «Бычий симметричный треугольник» на восходящем тренде свидетельствует о продолжении текущего движения, где, в случае пробоя значения 1.8834, возможно движение к 1.8849.
Таймфреймы М5 и М15 могут иметь больше ложных точек входа.
Shuningdek ko'ring
- Все
- Вымпел
- Голова и плечи
- Двойная вершина
- Прямоугольник
- Треугольник
- Тройная вершина
- Флаг
- Все
- #AAPL
- #AMZN
- #Bitcoin
- #EBAY
- #FB
- #GOOG
- #INTC
- #KO
- #MA
- #MCD
- #MSFT
- #NTDOY
- #PEP
- #TSLA
- #TWTR
- AUDCAD
- AUDCHF
- AUDJPY
- AUDUSD
- EURCAD
- EURCHF
- EURGBP
- EURJPY
- EURNZD
- EURRUB
- EURUSD
- GBPAUD
- GBPCHF
- GBPJPY
- GBPUSD
- GOLD
- NZDCAD
- NZDCHF
- NZDJPY
- NZDUSD
- SILVER
- USDCAD
- USDCHF
- USDJPY
- USDRUB
- Все
- M5
- M15
- M30
- H1
- D1
- Все
- Покупка
- Продажа
- Все
- 1
- 2
- 3
- 4
- 5

On the chart of the NZDUSD M5 trading instrument, the Triple Top pattern that signals a trend change has formed. It is possible that after formation of the third peak
The M5 and M15 time frames may have more false entry points.
Открыть график инструмента в новом окне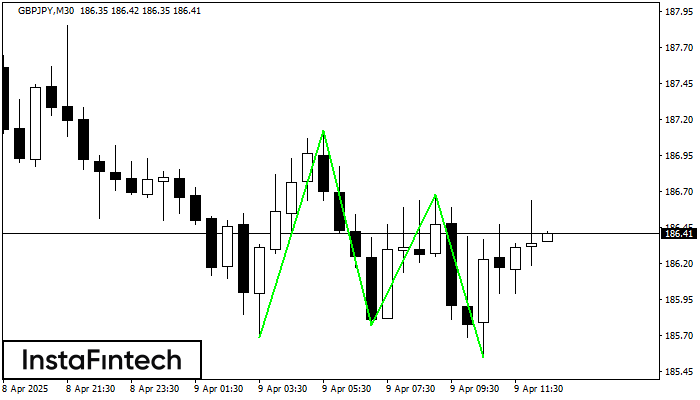
The Triple Bottom pattern has formed on the chart of GBPJPY M30. Features of the pattern: The lower line of the pattern has coordinates 187.12 with the upper limit 187.12/186.68
Открыть график инструмента в новом окне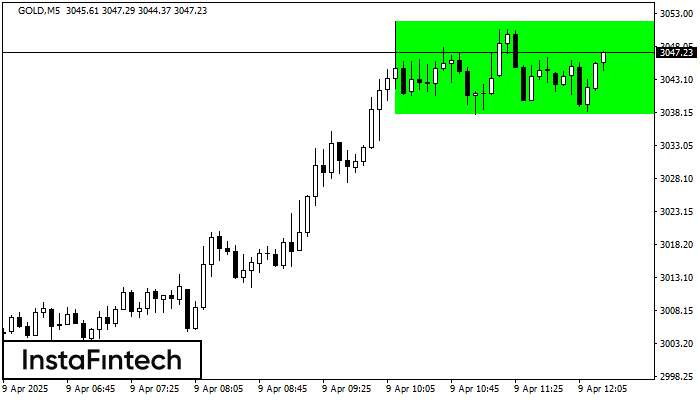
According to the chart of M5, GOLD formed the Bullish Rectangle. This type of a pattern indicates a trend continuation. It consists of two levels: resistance 3051.82 and support 3037.74
The M5 and M15 time frames may have more false entry points.
Открыть график инструмента в новом окне