empty
16.10.2023 11:40 AM
Weekly forecast based on simplified wave analysis for GBP/USD, AUD/USD, USD/CHF, EUR/JPY, and US Dollar Index on October 16th

GBP/USD

Brief Analysis:

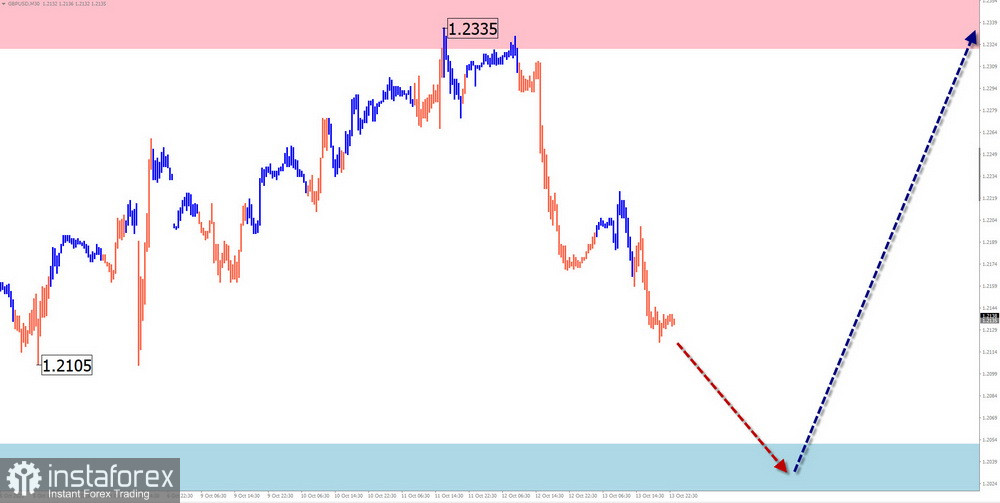
The current wave structure of the British pound chart, at the time of analysis, counts from mid-July. Its wave level has reached the upper boundary of a strong potential daily reversal zone. Over the last two weeks, quotes have formed a zigzag pattern in the form of a stretched horizontal plane. The corrective structure is unfinished at the time of analysis.

Weekly Forecast:

In the upcoming week, the price of the pair is expected to move within a range between the nearest opposing zones. A bearish vector is more likely at the beginning of the week. A price decline can be expected due to the calculated support. By the end of the week, there is an increased likelihood of a change in direction.

This image is no longer relevant

Potential Reversal Zones

Resistance:

  • 1.2320/1.2370

Support:

  • 1.2050/1.2000

Recommendations:

Purchases: The resistance zone has a limit. After the appearance of reversal signals in the resistance zone, purchases with a reduced volume within the intraday framework will become possible.

Sales: Possible within separate sessions with reduced volume.

AUD/USD

Brief Analysis:

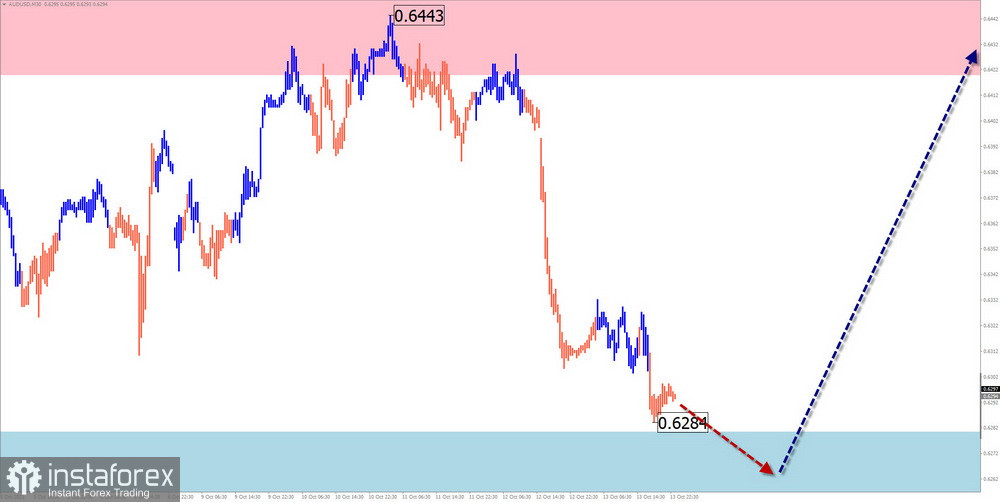
The Australian dollar market continues its southward movement on the price chart. The unfinished segment counts from mid-July. Within this segment, in the last decade, the price has formed a flat correction that is unfinished at the time of analysis. Quotes are near the lower boundary of strong resistance.

Weekly Forecast:

In the next couple of days, a sideways range is expected, in which conditions for a change in direction will be formed. The beginning of a decline is likely closer to the end of the week. It is unlikely that the price will move below the calculated support within the next week.

This image is no longer relevant

Potential Reversal Zones

Resistance:

  • 0.6420/0.6470

Support:

  • 0.6280/0.6230

Recommendations:

Purchases: will become relevant after the appearance of confirmed reversal signals in the resistance zone.

Sales: high-risk and not recommended.

USD/CHF

Brief Analysis:

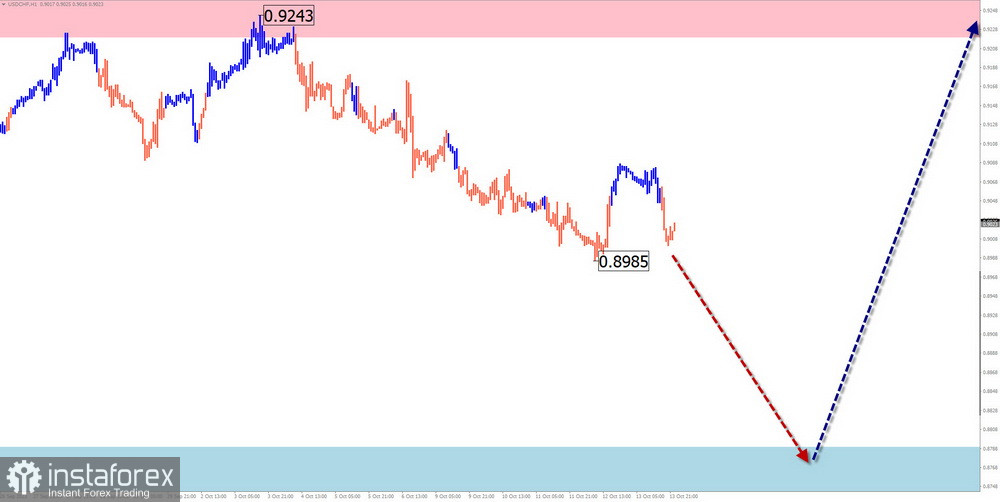
The current wave structure of the Swiss franc major chart is directed upward. It started on July 14th. On the larger daily chart, this segment became a correction. The price has reached the lower boundary of a strong resistance zone. In the past two weeks, the pair's quotes have been retracing downward from this level, forming a corrective flat.

Weekly Forecast:

At the beginning of the upcoming week, there is a high probability of continued decline, possibly down to the support zone. A brief breakthrough of its lower boundary is possible. Closer to the weekend, the likelihood of a reversal and a resumption of price growth increases.

This image is no longer relevant

Potential Reversal Zones

Resistance:

  • 0.9220/0.9270

Support:

  • 0.8790/0.8740

Recommendations

Sales: Can be used for short-term trading with a reduced lot size.

Purchases: will become possible after the appearance of reversal signals in the support area, according to your trading system (TS).

EUR/JPY

Brief Analysis:

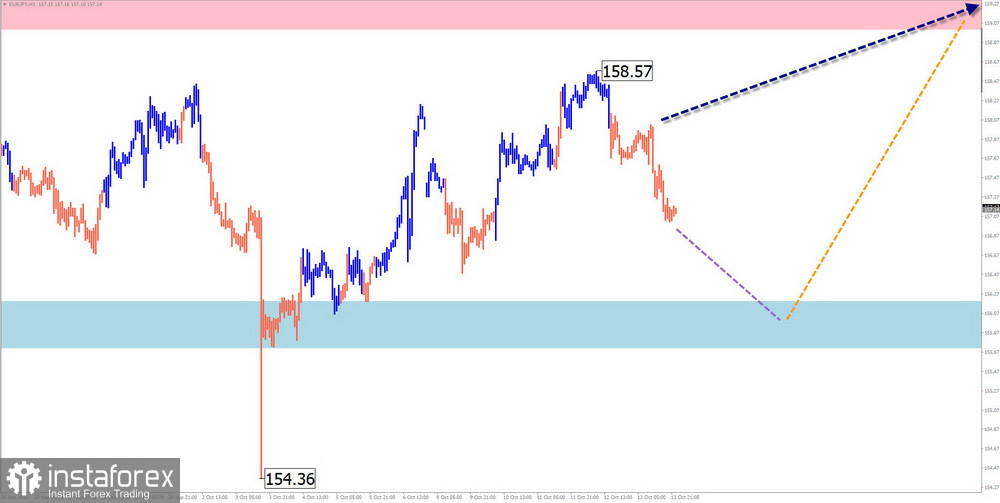
An ascending wave pattern has been controlling the price movement of the euro against the Japanese yen since late July of this year. In its structure, the middle part (B) has been forming for the last three months. During this time, the price has moved in a sideways pattern, forming a price corridor of approximately 3 price figures.

Weekly Forecast:

At the beginning of the upcoming week, the price of the pair is expected to experience a flat decline down to the calculated support level. Afterwards, you can expect a reversal and a resumption of price growth. The resistance zone shows the most likely upper boundary of the pair's weekly movement.

This image is no longer relevant

Potential Reversal Zones

Resistance:

  • 159.00/159.50

Support:

  • 156.20/155.70

Recommendations

Sales: Possible with a reduced lot size within a separate session. The support zone limits the potential for a decline.

Purchases: will become relevant after the appearance of confirmed reversal signals in the support area.
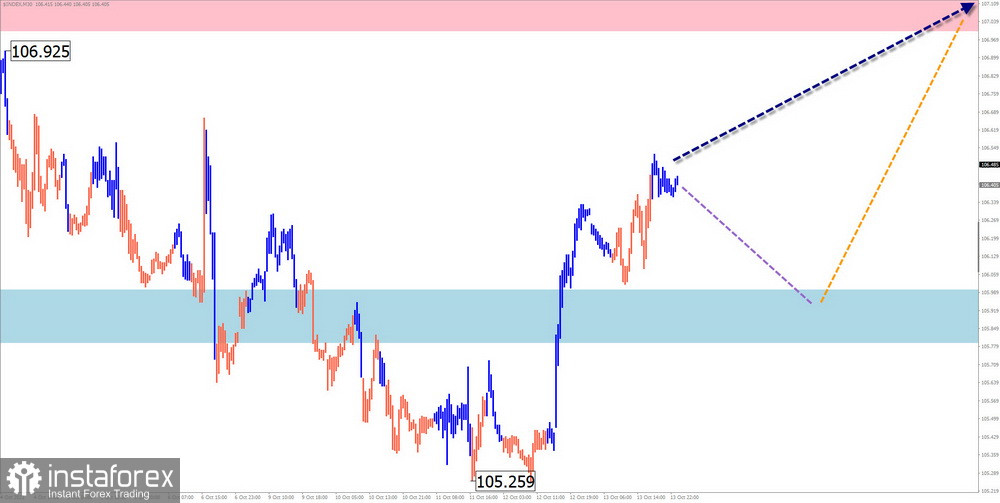
US Dollar Index

Brief Analysis:

As a result of a three-month bullish trend, the dollar quotes are approaching the lower boundary of a powerful potential reversal zone. The unfinished segment of the main course started on October 4th. In its structure, the middle part of the wave (B) is forming in the form of a stretched flat.

Weekly Forecast:

Throughout the upcoming week, the dollar is expected to move within a price range between opposing zones. At the beginning of the week, a downward vector is more likely. A change in direction can be expected closer to the weekend. A breakthrough in the calculated zones within the week is unlikely.

This image is no longer relevant

Potential Reversal Zones

Resistance:

  • 107.00/107.20

Support:

  • 106.00/105.80

Recommendations

Purchases: Short-term deals for strengthening positions in national currencies in major pairs may be possible.

Sales: This will be recommended for national currencies after the strengthening begins in the support zone of the US dollar quotes.

Note: In simplified wave analysis (SWA), all waves consist of three parts (A, B, and C). The analysis focuses on the last unfinished wave in each time frame. Dotted lines indicate expected movements.

Attention: The wave algorithm does not consider the duration of instrument movements in time.

เลือกช่วงเวลา
5
นาที
15
นาที
30
นาที
1
ชั่วโมง
4
ชั่วโมง
1
วัน
1
สัปดาห์
รับผลกำไรจากการเปลี่ยนแปลงอัตราสกุลเงินดิจิทัลกับ InstaForex.
ดาวน์โหลด MetaTrader 4 และเปิดการซื้อขายครั้งแรกของคุณ.
  • Grand Choice
    Contest by
    InstaForex
    InstaForex always strives to help you
    fulfill your biggest dreams.
    เข้าร่วมการแข่งขัน


บทความแนะนำ

การวิเคราะห์ EUR/USD ณ วันที่ 25 เมษายน 2025

รูปแบบของคลื่นในกราฟ 4 ชั่วโมงของ EUR/USD ได้เปลี่ยนไปเป็นรูปแบบขาขึ้น สามารถกล่าวได้ว่าการเปลี่ยนแปลงนี้เกิดขึ้นอย่างสิ้นเชิงจากนโยบายการค้าของสหรัฐฯ ที่มีการเปลี่ยนแปลงใหม่ ก่อนถึงวันที่ 28 กุมภาพันธ์ ซึ่งเป็นวันที่ดอลลาร์เริ่มลดลงอย่างหนัก รูปแบบคลื่นทั้งหมดนั้นดูเหมือนเป็นส่วนของแนวโน้มขาลงที่แข็งแกร่ง กำลังอยู่ในกระบวนการของคลื่นแก้ไขที่ 2 อย่างไรก็ตาม

Chin Zhao 20:26 2025-04-25 UTC+2

บทวิเคราะห์ GBP/USD ประจำวันที่ 25 เมษายน 2025

รูปแบบคลื่นในกราฟ GBP/USD ได้เปลี่ยนไปเป็นโครงสร้างขาขึ้นแบบแรงกระตุ้น—"ขอบคุณ" Donald Trump ภาพคลื่นนี้คล้ายคลึงกับคู่ EUR/USD มาก จนถึงวันที่ 28 กุมภาพันธ์ เราสังเกตเห็นการก่อตัวของโครงสร้างการแก้ไขที่แข็งแกร่งซึ่งไม่น่ากังวล อย่างไรก็ตาม ความต้องการดอลลาร์สหรัฐเริ่มลดลงอย่างรวดเร็ว จึงเกิดโครงสร้างขาขึ้น

Chin Zhao 20:21 2025-04-25 UTC+2

การวิเคราะห์ GBP/USD ในวันที่ 24 เมษายน 2025

รูปแบบคลื่นสำหรับ GBP/USD ได้เปลี่ยนเป็นโครงสร้างขาขึ้นแบบแรงกระตุ้นแล้ว—"ขอบคุณ" Donald Trump โครงสร้างคลื่นเกือบจะเหมือนกับ EUR/USD อย่างไม่มีข้อสงสัยใดๆ จนถึงวันที่ 28 กุมภาพันธ์ เราได้สังเกตการเกิดรูปแบบการปรับตัวที่น่าเชื่อถือ แต่หลังจากนั้นความต้องการสกุลเงินสหรัฐฯ ก็เริ่มลดลงอย่างรวดเร็ว นำไปสู่การพัฒนาของโครงสร้างคลื่นห้าขึ้น

Chin Zhao 20:18 2025-04-24 UTC+2

วิเคราะห์ EUR/USD ประจำวันที่ 24 เมษายน 2025

รูปแบบคลื่นในกราฟ 4 ชั่วโมงของ EUR/USD ได้เปลี่ยนเป็นโครงสร้างที่มีแรงกระตุ้นขึ้น ฉันเชื่อว่าไม่มีข้อสงสัยใดๆ ว่าการเปลี่ยนแปลงนี้เกิดขึ้นเพียงเพราะนโยบายการค้าใหม่ของสหรัฐฯ ก่อนวันที่ 28 กุมภาพันธ์ เมื่อการลดลงของดอลลาร์สหรัฐฯ เริ่มขึ้น รูปแบบคลื่นแสดงให้เห็นถึงแนวโน้มขาลงที่น่าเชื่อถือ โดยเป็นการสร้างคลื่นปรับฐาน

Chin Zhao 20:14 2025-04-24 UTC+2

การวิเคราะห์ EUR/USD วันที่ 23 เมษายน 2025

โครงสร้างคลื่นในกราฟ 4 ชั่วโมงสำหรับคู่เงิน EUR/USD ได้เปลี่ยนไปเป็นรูปแบบคลื่นขาขึ้นแบบแรงกระตุ้น ฉันเชื่อว่าไม่มีใครสงสัยว่าการเปลี่ยนแปลงนี้เกิดขึ้นเพียงเพราะนโยบายการค้าใหม่ของสหรัฐอเมริกา ก่อนวันที่ 28 กุมภาพันธ์ เมื่อเงินดอลลาร์ของสหรัฐฯ เริ่มลดลงอย่างรวดเร็ว โครงสร้างคลื่นทั้งหมดดูเหมือนแนวโน้มขาลงที่แข็งแกร่ง — ก่อตัวเป็นคลื่นปรับตัว

Chin Zhao 18:44 2025-04-23 UTC+2

วิเคราะห์ GBP/USD วันที่ 23 เมษายน 2025

โครงสร้างคลื่นในกราฟ GBP/USD ก็เปลี่ยนไปในรูปแบบบูลลิชและมีแรงกระตุ้นจาก "ผลจาก" Donald Trump เช่นเดียวกัน รูปแบบคลื่นนี้เกือบจะเหมือนกับ EUR/USD จนถึงวันที่ 28 กุมภาพันธ์ เราสังเกตเห็นการพัฒนาของโครงสร้างการปรับเปลี่ยนที่น่าเชื่อถือซึ่งไม่มีความกังวลใด ๆ อย่างไรก็ตาม

Chin Zhao 18:40 2025-04-23 UTC+2

การวิเคราะห์ GBP/USD ในวันที่ 22 เมษายน 2025

รูปแบบคลื่นในกราฟ GBP/USD ยังได้แปรเปลี่ยนเป็นโครงสร้างเชิงบวกที่แรงเกินคาด — อย่างไรก็ตาม "ขอบคุณ" โดนัลด์ ทรัมป ซึ่งรูปแบบคลื่นแทบจะเหมือนกับคู่เงิน EUR/USD โดยถึงวันที่ 28 กุมภาพันธ์ เราสังเกตเห็นการเกิดโครงสร้างแก้ไขที่แน่นหนาซึ่งไม่มีปัญหา แต่หลังจากนั้น

Chin Zhao 20:05 2025-04-22 UTC+2

วิเคราะห์ EUR/USD วันที่ 21 เมษายน 2025

โครงสร้างคลื่นบนกราฟ 4 ชั่วโมงสำหรับคู่เงิน EUR/USD ได้เปลี่ยนไปสู่รูปแบบที่เป็นบวก ฉันเชื่อว่าไม่มีข้อกังขาใดที่การเปลี่ยนแปลงนี้เกิดขึ้นได้เนื่องจากนโยบายการค้าของสหรัฐฯ ที่ใหม่เท่านั้น ก่อนวันที่ 28 กุมภาพันธ์ เมื่อการลดลงอย่างรวดเร็วของดอลลาร์สหรัฐเริ่มขึ้น โครงสร้างคลื่นทั้งหมดดูเหมือนเป็นแนวโน้มขาลงที่ชัดเจน คลื่นที่ 2 ของโครงสร้างการแก้ไขกำลังก่อตัว

Chin Zhao 19:46 2025-04-21 UTC+2

วิเคราะห์ GBP/USD วันที่ 21 เมษายน 2025

โครงสร้างคลื่นสำหรับ GBP/USD ก็ได้เปลี่ยนแปลงเป็นรูปแบบที่เพิ่มสูงขึ้น (bullish) ด้วยความอนุเคราะห์จาก Donald Trump โดยภาพคลื่นนั้นแทบจะเหมือนกับ EUR/USD อย่างมาก จนถึงวันที่ 28 กุมภาพันธ์ เราได้เฝ้าสังเกตการก่อตัวของโครงสร้างที่แก้ไขที่น่าเชื่อถือซึ่งไม่ทำให้กังวล อย่างไรก็ตาม

Chin Zhao 19:44 2025-04-21 UTC+2

การพยากรณ์รายสัปดาห์บนพื้นฐานของการวิเคราะห์คลื่นที่ง่ายขึ้นสำหรับ GBP/USD, AUD/USD, USD/CHF, EUR/JPY, AUD/JPY, และดัชนีดอลลาร์สหรัฐ — 21 เมษายน

GBP/USD การวิเคราะห์: ตั้งแต่ต้นปีนี้ GBP/USD ได้มีการเคลื่อนตัวในคลื่นขาขึ้นบนกราฟรายวัน ขณะนี้คู่สกุลเงินได้มาถึงขอบเขตของโซนพลิกกลับที่เป็นไปได้ เมื่อทำการวิเคราะห์ราคาอยู่ใกล้กับพื้นที่ต้านทานที่คำนวณไว้ การพยากรณ์: ในอีกไม่กี่วันข้างหน้า คาดว่าจะมีแรงกดดันต่อโซนต้านทาน การพลิกกลับและการเริ่มเคลื่อนไหวขาลงอาจตามมา หากแนวโน้มเปลี่ยนแปลง อาจเกิดการทะลุระดับต้านทานเป็นระยะเวลาสั้น ขอบล่างของช่วงคาดการณ์รายสัปดาห์จะถูกกำหนดโดยการสนับสนุนที่คำนวณไว้ โซนกลับตัวที่อาจเกิดขึ้น

Isabel Clark 09:31 2025-04-21 UTC+2
หากไม่สะดวกคุยในตอนนี้
ระบุคำถามไว้ได้ใน แชท.
Widget callback
 

Dear visitor,

Your IP address shows that you are currently located in the USA. If you are a resident of the United States, you are prohibited from using the services of InstaFintech Group including online trading, online transfers, deposit/withdrawal of funds, etc.

If you think you are seeing this message by mistake and your location is not the US, kindly proceed to the website. Otherwise, you must leave the website in order to comply with government restrictions.

Why does your IP address show your location as the USA?

  • - you are using a VPN provided by a hosting company based in the United States;
  • - your IP does not have proper WHOIS records;
  • - an error occurred in the WHOIS geolocation database.

Please confirm whether you are a US resident or not by clicking the relevant button below. If you choose the wrong option, being a US resident, you will not be able to open an account with InstaForex anyway.

We are sorry for any inconvenience caused by this message.