signal strength 2 of 5
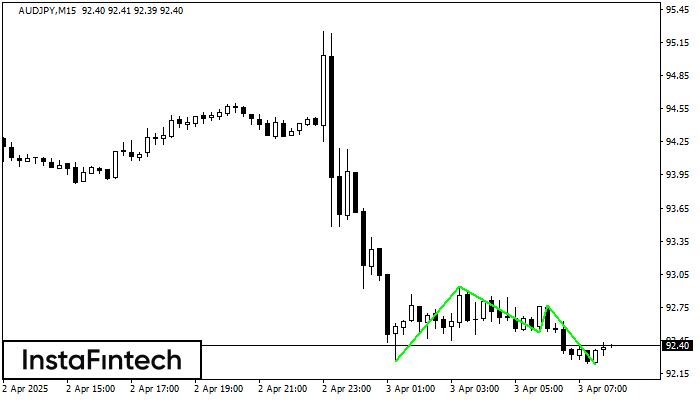
The Triple Bottom pattern has been formed on AUDJPY M15. It has the following characteristics: resistance level 92.94/92.77; support level 92.26/92.23; the width is 68 points. In the event of a breakdown of the resistance level of 92.94, the price is likely to continue an upward movement at least to 92.75.
The M5 and M15 time frames may have more false entry points.
Vea asimismo
- All
- Double Top
- Flag
- Head and Shoulders
- Pennant
- Rectangle
- Triangle
- Triple top
- All
- #AAPL
- #AMZN
- #Bitcoin
- #EBAY
- #FB
- #GOOG
- #INTC
- #KO
- #MA
- #MCD
- #MSFT
- #NTDOY
- #PEP
- #TSLA
- #TWTR
- AUDCAD
- AUDCHF
- AUDJPY
- AUDUSD
- EURCAD
- EURCHF
- EURGBP
- EURJPY
- EURNZD
- EURRUB
- EURUSD
- GBPAUD
- GBPCHF
- GBPJPY
- GBPUSD
- GOLD
- NZDCAD
- NZDCHF
- NZDJPY
- NZDUSD
- SILVER
- USDCAD
- USDCHF
- USDJPY
- USDRUB
- All
- M5
- M15
- M30
- H1
- D1
- All
- Buy
- Sale
- All
- 1
- 2
- 3
- 4
- 5

According to the chart of M5, GOLD formed the Bearish Rectangle which is a pattern of a trend continuation. The pattern is contained within the following borders: lower border 3312.24
The M5 and M15 time frames may have more false entry points.
Open chart in a new window
The Double Bottom pattern has been formed on NZDCAD M30. Characteristics: the support level 0.8188; the resistance level 0.8232; the width of the pattern 44 points. If the resistance level
Open chart in a new window
The Bullish Flag pattern has been formed on NZDCHF at M5. The lower boundary of the pattern is located at 0.4839/0.4829, while the higher boundary lies at 0.4849/0.4839. The projection
The M5 and M15 time frames may have more false entry points.
Open chart in a new window