signal strength 1 of 5
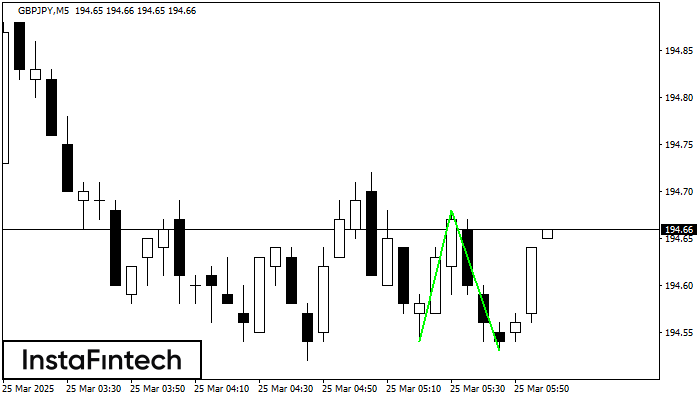
The Double Bottom pattern has been formed on GBPJPY M5. Characteristics: the support level 194.54; the resistance level 194.68; the width of the pattern 14 points. If the resistance level is broken, a change in the trend can be predicted with the first target point lying at the distance of 15 points.
The M5 and M15 time frames may have more false entry points.
Vea asimismo
- All
- Double Top
- Flag
- Head and Shoulders
- Pennant
- Rectangle
- Triangle
- Triple top
- All
- #AAPL
- #AMZN
- #Bitcoin
- #EBAY
- #FB
- #GOOG
- #INTC
- #KO
- #MA
- #MCD
- #MSFT
- #NTDOY
- #PEP
- #TSLA
- #TWTR
- AUDCAD
- AUDCHF
- AUDJPY
- AUDUSD
- EURCAD
- EURCHF
- EURGBP
- EURJPY
- EURNZD
- EURRUB
- EURUSD
- GBPAUD
- GBPCHF
- GBPJPY
- GBPUSD
- GOLD
- NZDCAD
- NZDCHF
- NZDJPY
- NZDUSD
- SILVER
- USDCAD
- USDCHF
- USDJPY
- USDRUB
- All
- M5
- M15
- M30
- H1
- D1
- All
- Buy
- Sale
- All
- 1
- 2
- 3
- 4
- 5

The GBPAUD M5 formed the Head and Shoulders pattern with the following features: The Head’s top is at 2.0878, the Neckline and the upward angle are at 2.0820/2.0825. The formation
The M5 and M15 time frames may have more false entry points.
Open chart in a new window
According to the chart of M5, GOLD formed the Bearish Rectangle which is a pattern of a trend continuation. The pattern is contained within the following borders: lower border 3312.24
The M5 and M15 time frames may have more false entry points.
Open chart in a new window
The Double Bottom pattern has been formed on NZDCAD M30. Characteristics: the support level 0.8188; the resistance level 0.8232; the width of the pattern 44 points. If the resistance level
Open chart in a new window