

signal strength 1 of 5
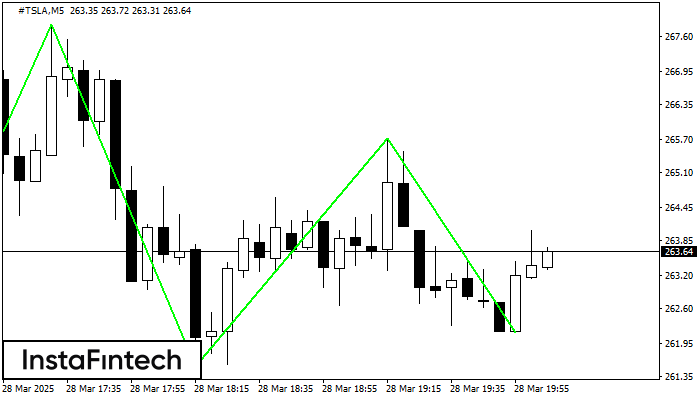
The Triple Bottom pattern has been formed on #TSLA M5. It has the following characteristics: resistance level 267.82/265.73; support level 260.65/262.15; the width is 717 points. In the event of a breakdown of the resistance level of 267.82, the price is likely to continue an upward movement at least to 261.68.
The M5 and M15 time frames may have more false entry points.
See Also
- All
- Double Top
- Flag
- Head and Shoulders
- Pennant
- Rectangle
- Triangle
- Triple top
- All
- #AAPL
- #AMZN
- #Bitcoin
- #EBAY
- #FB
- #GOOG
- #INTC
- #KO
- #MA
- #MCD
- #MSFT
- #NTDOY
- #PEP
- #TSLA
- #TWTR
- AUDCAD
- AUDCHF
- AUDJPY
- AUDUSD
- EURCAD
- EURCHF
- EURGBP
- EURJPY
- EURNZD
- EURRUB
- EURUSD
- GBPAUD
- GBPCHF
- GBPJPY
- GBPUSD
- GOLD
- NZDCAD
- NZDCHF
- NZDJPY
- NZDUSD
- SILVER
- USDCAD
- USDCHF
- USDJPY
- USDRUB
- All
- M5
- M15
- M30
- H1
- D1
- All
- Buy
- Sale
- All
- 1
- 2
- 3
- 4
- 5
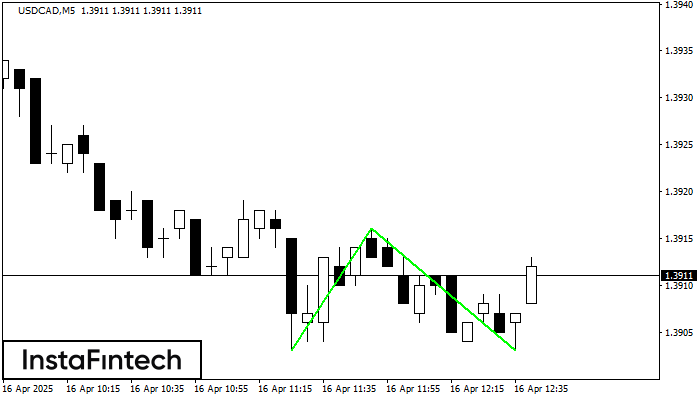
O padrão Fundo duplo foi formado em USDCAD M5; o limite superior é 1.3916; o limite inferior é 1.3903. A largura do padrão é de 13 pontos. No caso
Os intervalos M5 e M15 podem ter mais pontos de entrada falsos.
Open chart in a new window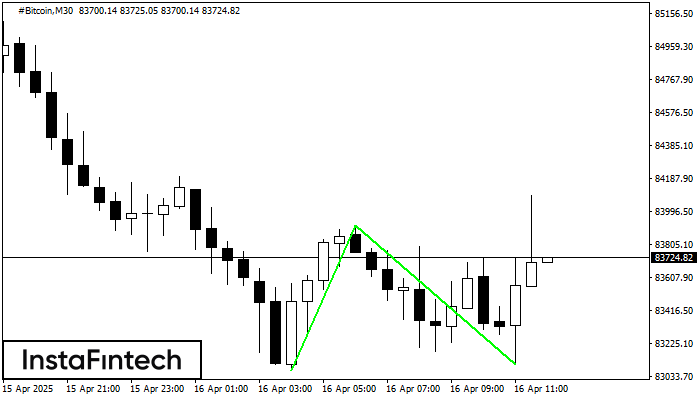
O padrão Fundo duplo foi formado em #Bitcoin M30; o limite superior é 83915.56; o limite inferior é 83100.24. A largura do padrão é de 84817 pontos. No caso
Open chart in a new window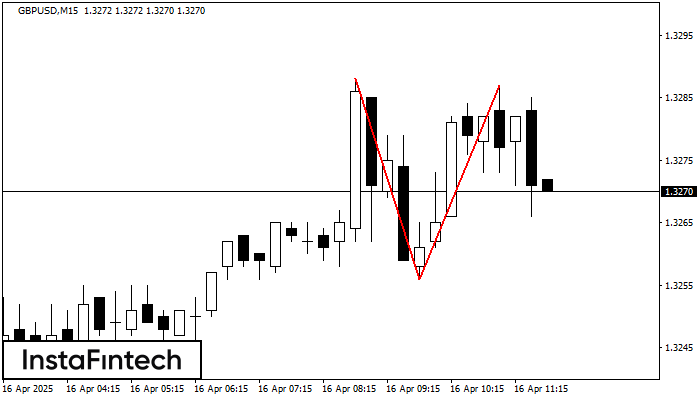
O padrão de reversão Topo duplo foi formado em GBPUSD M15. Características: o limite superior 1.3288; o limite inferior 1.3256; a largura do padrão é de 31 pontos. As operações
Os intervalos M5 e M15 podem ter mais pontos de entrada falsos.
Open chart in a new window


