Analyzing Friday's trades:
GBP/USD on 1H chart
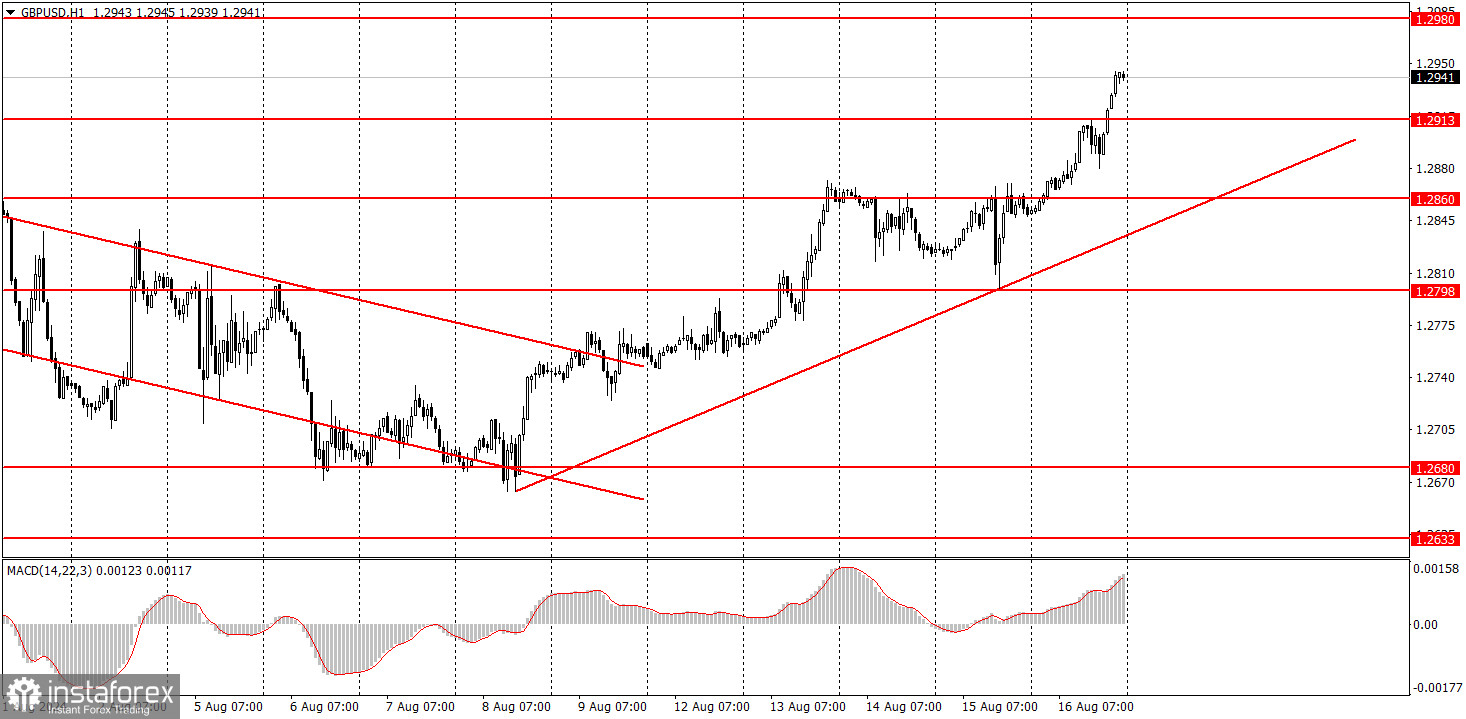
On Friday, the GBP/USD pair sustained its notable upward movement. In the morning, the UK released its retail sales report, which matched forecasts, but the previous month's figures were revised upward. This report partly triggered the new rise of the British currency from the early morning. However, it is worth noting that the pound sterling rose even at night while at local highs. Therefore, it is unlikely that the retail sales report was the sole reason for the new strengthening of the British currency.
During the U.S. trading session, two reports were released, one worse than expected and the other better. Naturally, the market reacted only to the first report while the pound continued to climb to new highs. Thus, as before, the market responds only to positive reports for the pound and ignores or uses the rest for minor pullbacks.
GBP/USD on 5M chart
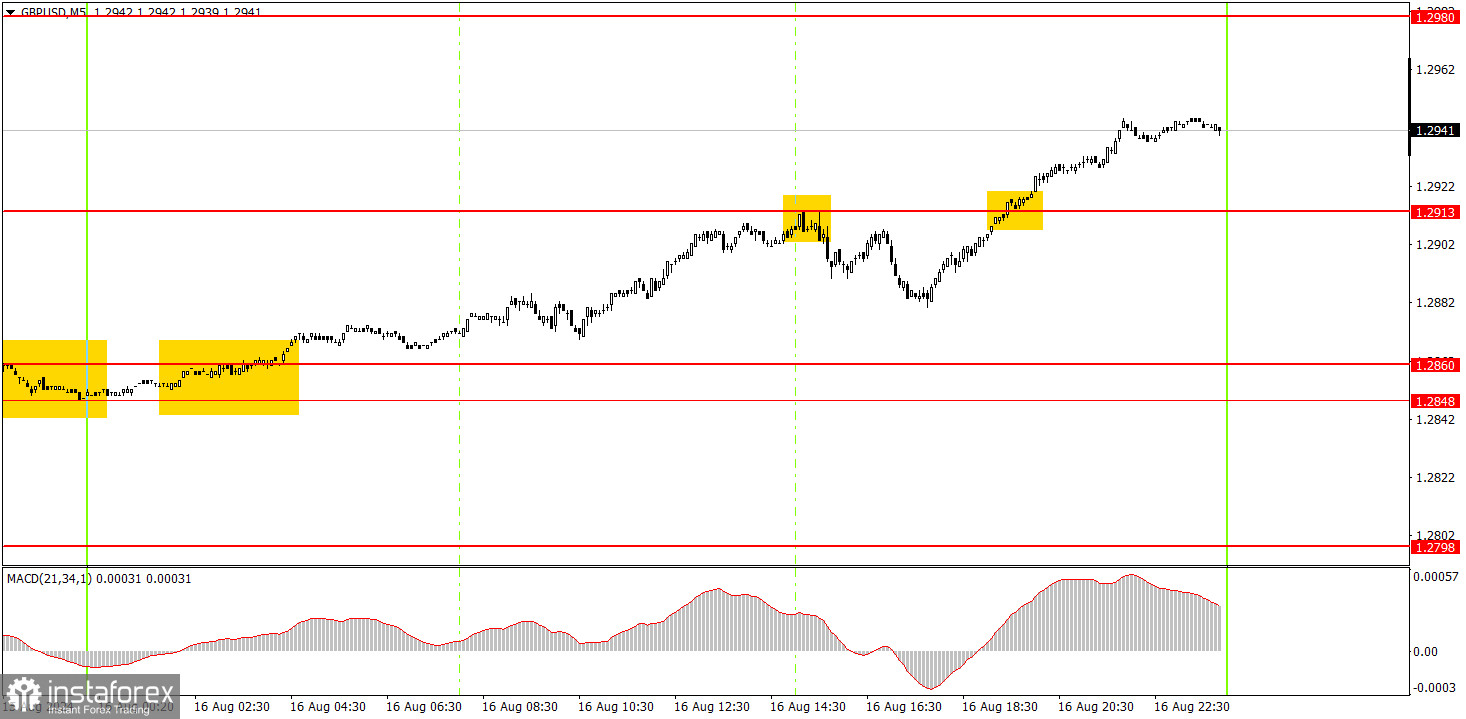
In the 5-minute time frame, several trading signals were formed on Friday. The first buy signal appeared during the night, but by the opening of the European session, the price had only moved a short distance from the formation point. Therefore, long positions could and should have been opened. The price bounced off the first target at the beginning of the U.S. trading session – the 1.2913 level. This was the point to close long positions and open short ones. The price only managed to drop 17 pips before returning to and surpassing the 1.2913 level by the end of the day. Thus, the short position should have been closed at break-even. The final buy signal could have been profitable, but it was formed several hours before the market closed.
Trading tips on Monday:
In the hourly time frame, GBP/USD has a good chance of sustaining the downtrend but is going through an upward correction. The British pound is still overbought, while the dollar is undervalued, and the market continues to use every opportunity to buy the British currency. It often ignores any unfavorable reports. The rare positive reports from the U.S. occasionally appear to provide very little support for the dollar.
On Monday, the pair might experience a slight pullback, but it is unlikely that the upward trend will be broken.
The key levels to consider on the 5M timeframe are 1.2547, 1.2605-1.2633, 1.2684-1.2693, 1.2748, 1.2791-1.2798, 1.2848-1.2860, 1.2913, 1.2980-1.2993, 1.3043, 1.3102-1.3107, 1.3145. On Monday, no significant events are scheduled in the UK or the US, so volatility is likely to be low, and the pair is expected to move predominantly sideways.
Basic rules of a trading system:
1) The strength of a signal is determined by the time it took for the signal to form (bounce or level breakthrough). The shorter the time required, the stronger the signal.
2) If two or more trades around a certain level are initiated based on false signals, subsequent signals from that level should be ignored.
3) In a flat market, any currency pair can produce multiple false signals or none at all. In any case, it's better to stop trading at the first signs of a flat market.
4) Trades should be opened between the start of the European session and mid-way through the U.S. session. All trades must be closed manually after this period.
5) In the hourly time frame, trades based on MACD signals are only advisable amidst substantial volatility and an established trend, confirmed either by a trendline or trend channel.
6) If two levels are too close to each other (from 5 to 20 pips), they should be considered as a support or resistance zone.
7) After moving 15 pips in the intended direction, the Stop Loss should be set to break-even.
What's on the charts:
Support and Resistance price levels: targets when opening long or short positions. You can place Take Profit levels near them.
Red lines: channels or trend lines that depict the current trend and indicate the preferred trading direction.
The MACD (14,22,3) indicator, encompassing both the histogram and signal line, acts as an auxiliary tool and can also be used as a source of signals.
Important speeches and reports (always noted in the news calendar) can profoundly influence the price dynamics. Hence, trading during their release calls for heightened caution. It may be reasonable to exit the market to prevent abrupt price reversals against the prevailing trend.
Beginners should always remember that not every trade will yield profit. Establishing a clear strategy, coupled with effective money management, is key to long-term success in trading.