empty
02.04.2024 10:19 AM
GBP/USD: technical analysis on April 2. GBP pulling back again, but bulls alert

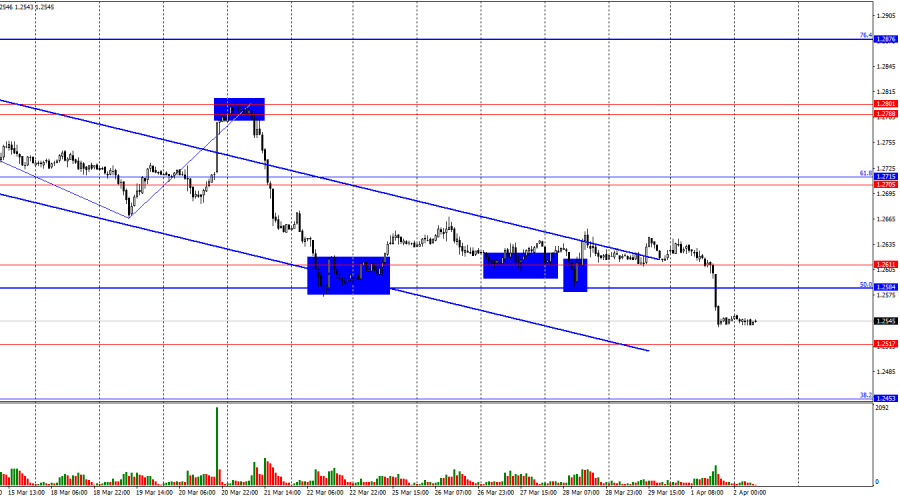
Hi, dear traders! On the 2-hour chart on Monday, the GBP/USD pair performed a new reversal in favor of the American currency and consolidated under the support zone of 1.2584–1.2611, which prevented the British currency from a further fall for a whole week. Now the fall in GBP/USD can continue in the direction of the lower level of 1.2517. Consolidation below 1.2517 will increase the likelihood of a further decline in the direction of the 38.2% correction level of 1.2453. The trend remains bearish.

This image is no longer relevant

The situation with waves recently has not raised any questions. The last completed upward wave failed to reach the peak of the previous wave. The new downward wave (which is being formed at this time) easily broke through the last low from March 19. Thus, the trend for the GBP/USD pair is now bearish and there are no signs of completion. It just started recently. The first sign of the bulls going on the offensive could be a breakout of the high of March 21. But to reach the 1.2788-1.2801 zone, the bulls need to cover a distance of about 270 pips, which may take a long time. Thus, a change in trend will hardly happen in the near future.

On Monday, the ISM business activity index in the US benefited the dollar. The PMI reading turned out to be significantly higher than traders' expectations, which supported the bears in their endeavors. I believe that the information background continues to encourage the bears, even without taking into account yesterday's ISM index. However, this week, there will be crucial reports on the US labor market and unemployment, which tend to disappoint the market from time to time. Today, for example, the JOLTS report may stop the victorious growth of the dollar. If it turns out that the number of job openings is less than expected, this could negatively affect the unemployment rate, which has risen in the US from 3.4% to 3.9% over the past year. Therefore, the bulls can become active for a short period.

This image is no longer relevant

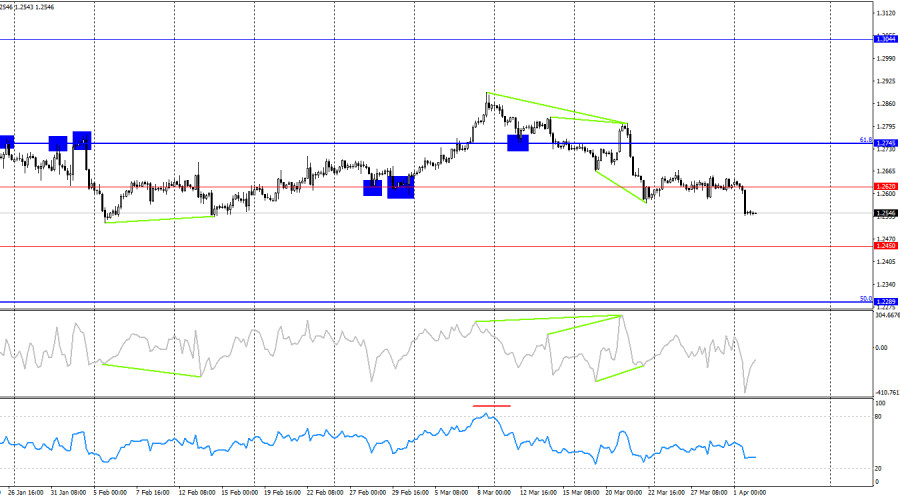
On the 4-hour chart, GBP/USD made a new reversal in favor of the dollar and consolidated below 1.2620. Thus, the instrument may extend its weakness in the direction of the next level of 1.2450. No new emerging divergences are observed in any indicator. A rebound in the price from 1.2450 will work in favor of the British pound. Also, a rebound can be made from the level of 1.2500, which is the low for the last few months.

Commitments of Traders (COT)

This image is no longer relevant

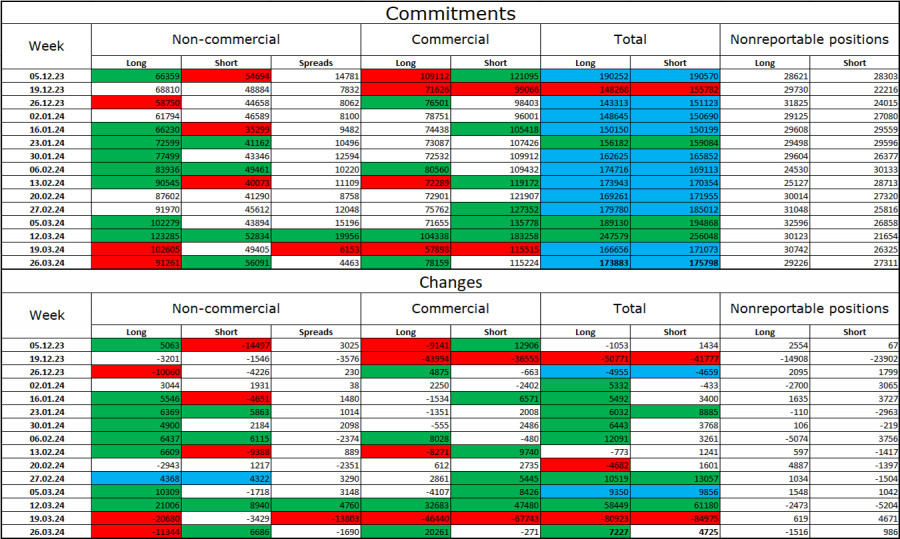
The sentiment of the Non-commercial category of traders became less bullish over the last reporting week. The number of long contracts in the hands of speculators decreased by 11,344, whereas the number of short contracts increased by 6,686. The overall sentiment among major players remains bullish, but has begun to weaken in recent weeks. The gap between the number of long and short contracts is already less than twofold: 91K versus 56K.

In my opinion, there are still prospects for a fall for the British currency, but over the past 2.5 months the number of longs has increased from 66K to 91K, and the number of shorts has remained virtually unchanged. I believe that over time, the bulls will begin to get rid of buy positions since all possible factors for buying the British pound have already been worked out. However, the bears continue to demonstrate their weakness, which prevents the pound from a fall.

Economic calendar for US and UK

UK: manufacturing PMI due at 08:30 UTC

US: JOLTs job openings due at 14:00 UTC

The economic calendar contains just two significant reports. The JOLTs job openings is the priority for traders. The information background could make a modest impact on market sentiment.

Outlook and trading tips on GBP/USD

Short positions on GBP/USD could be opened if the instrument consolidates under the zone of 1.2584–1.2611 with targets of 1.2517 and 1.2453. Now these transactions can be kept open with designated targets. I will not consider buying today since several dips from the zone of 1.2584–1.2611 proved passive buyers. Today there will be no such important reports that could put strong pressure on the US dollar.

Samir Klishi,
Especialista em análise na InstaForex
© 2007-2025
Selecionar intervalo de tempo
5
min
15
min
30
min
1
hora
4
horas
1
dia
1
s.
Ganhe com as variações das taxas das criptomoedas com a InstaForex.
Baixe o MetaTrader 4 e abra a sua primeira operação.
  • Grand Choice
    Contest by
    InstaForex
    InstaForex always strives to help you
    fulfill your biggest dreams.
    PARTICIPE DO CONCURSO

Recommended Stories

Sinais de negociação para o EUR/USD para 24-26 de abril de 2025: venda abaixo de 1,1435 (SMA 214 - 7/8 de Murray)

Nosso plano de negociação para as próximas horas é aguardar que o euro se recupere até os níveis de resistência próximos de 1,1429 ou 1,1435 para vender, com alvos

Dimitrios Zappas 21:44 2025-04-24 UTC+2

Análise técnica do movimento de preço da prata, quinta-feira, 24 de abril de 2025

No gráfico de 4 horas, o instrumento da commodity prata apresenta sinais de fortalecimento. Esse cenário é confirmado pelo movimento do preço, que está acima da WMA (30, deslocamento 2)

Arief Makmur 17:28 2025-04-24 UTC+2

Análise técnica do movimento de preços do índice Nasdaq 100, quinta-feira, 24 de abril de 2025.

Embora o índice Nasdaq 100 esteja se movimentando lateralmente no gráfico de 4 horas, a faixa de oscilação é relativamente ampla, o que ainda representa uma oportunidade promissora. Atualmente

Arief Makmur 17:25 2025-04-24 UTC+2

OURO: Os preços do ouro podem cair significativamente em um futuro próximo

Os preços do ouro passaram recentemente por uma correção significativa, refletindo as expectativas de que Estados Unidos e China iniciem negociações concretas sobre tarifas e comércio em geral. A declaração

Pati Gani 17:16 2025-04-24 UTC+2

Análise técnica do movimento intradiário de preços do AUD/JPY, quarta-feira, 23 de abril de 2025

Com a presença de uma divergência entre o movimento de preços do par AUD/JPY e o indicador Stochastic Oscillator, além do preço estar acima da média móvel ponderada (WMA)

Arief Makmur 16:00 2025-04-23 UTC+2

Análise técnica do movimento intradiário do preço do ouro, quarta-feira, 23 de abril de 2025

Ao observar o gráfico de 4 horas, o ouro ainda apresenta viés de alta. No entanto, a divergência entre o movimento de preços do ouro e o indicador Stochastic Oscillator

Arief Makmur 15:51 2025-04-23 UTC+2

Análise técnica do movimento intradiário de preços do GBP/CHF, terça-feira, 22 de abril de 2025

Ao analisarmos o gráfico de 4 horas do par cruzado GBP/CHF, observamos diversos elementos interessantes. Primeiramente, o surgimento de um padrão de triângulo, aliado ao movimento

Arief Makmur 15:50 2025-04-22 UTC+2

Análise técnica do movimento intradiário de preços do AUD/CAD, terça-feira, 22 de abril de 2025

Com o par AUD/CAD se movendo acima da média móvel ponderada de 21 períodos (WMA 21), que apresenta inclinação positiva, e com a ocorrência de convergência entre o movimento

Arief Makmur 15:47 2025-04-22 UTC+2

Análise técnica do movimento intradiário de preços do EUR/GBP, segunda-feira, 21 de abril de 2025

Com base no gráfico de 4 horas, o par EUR/GBP parece estar se movendo acima da EMA (100), o que indica que os compradores dominam o par. Assim, no futuro

Arief Makmur 15:36 2025-04-21 UTC+2

Análise técnica do movimento intradiário do USD/JPY, segunda-feira, 21 de abril de 2025.

Com o surgimento da convergência entre o movimento de preço do principal par de moedas USD/JPY, o indicador Oscilador Estocástico e a posição da EMA (100), que está acima

Arief Makmur 15:31 2025-04-21 UTC+2
Não pode falar agora?
Faça sua pergunta no chat.
Widget callback
 

Dear visitor,

Your IP address shows that you are currently located in the USA. If you are a resident of the United States, you are prohibited from using the services of InstaFintech Group including online trading, online transfers, deposit/withdrawal of funds, etc.

If you think you are seeing this message by mistake and your location is not the US, kindly proceed to the website. Otherwise, you must leave the website in order to comply with government restrictions.

Why does your IP address show your location as the USA?

  • - you are using a VPN provided by a hosting company based in the United States;
  • - your IP does not have proper WHOIS records;
  • - an error occurred in the WHOIS geolocation database.

Please confirm whether you are a US resident or not by clicking the relevant button below. If you choose the wrong option, being a US resident, you will not be able to open an account with InstaForex anyway.

We are sorry for any inconvenience caused by this message.