Analysis of EUR/USD 5M
On Thursday, the EUR/USD currency pair continued its downward movement. Volatility decreased slightly compared to Monday and Tuesday, but overall, it remains acceptable. The U.S. dollar has been rising for five consecutive days, something that hasn't happened for a long time. However, fortune has been on the side of the American currency this week. We've already mentioned that almost all macroeconomic data and the fundamental backdrop supported the growth of the U.S. dollar this week. The market, for once, didn't ignore all these factors. The only negative report was the ISM manufacturing sector activity index, which fell short of forecasts and remained below the "waterline" of 50.0.
Thus, the upward trend has ended, and the price continues to decline. Of course, today's labor market data could again spoil the picture for the dollar. Remember that the ADP report never correlates with NonFarm Payrolls, so it can't be used to predict NonFarms. Today, the unemployment rate and NonFarm Payrolls could again come in weaker than expected, increasing market expectations of a 0.5% rate cut by the Federal Reserve in November. This, in turn, could trigger a dollar selloff. However, the dollar can't fall forever, either. It's time for it to build "its own trend."
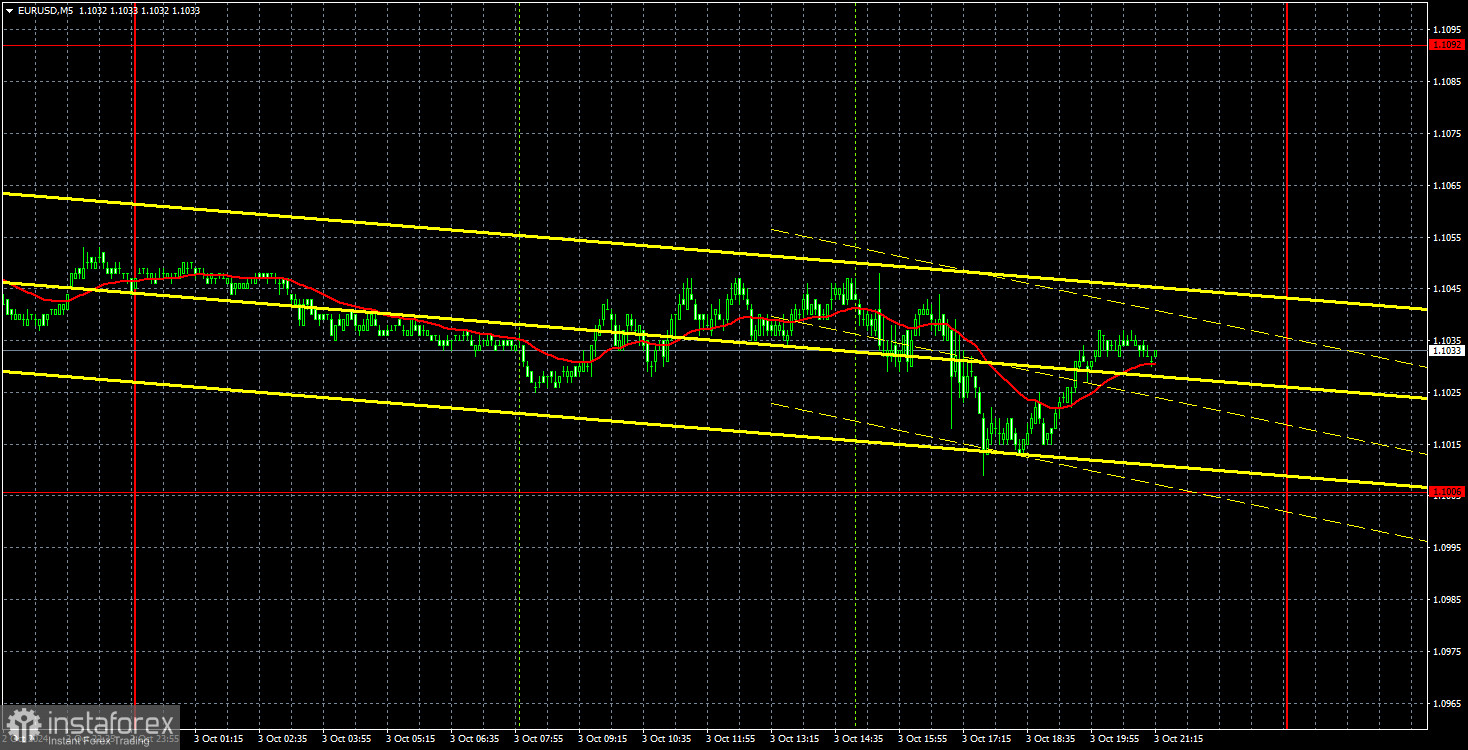
There is nothing significant to highlight from Thursday's trading signals, as the price approached the 1.1006 level only once during the day but failed to work through it. Thus, there were simply no signals to open trades. The ISM services activity index performed well but wasn't enough to outperform the 1.1006 level.
COT Report:
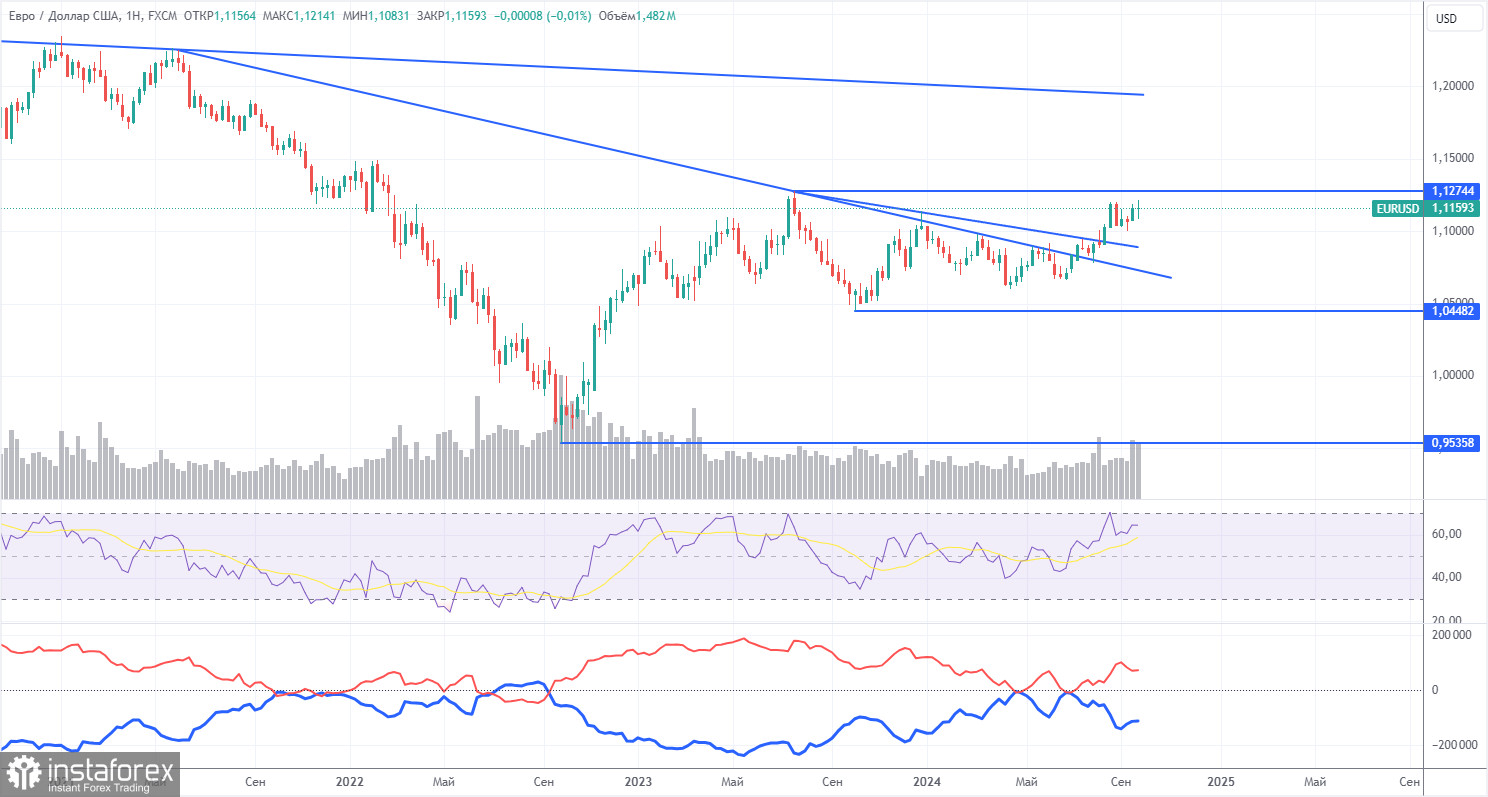
The latest COT (Commitment of Traders) report is dated September 24. The illustration above clearly shows that the net position of non-commercial traders has remained bullish for a long time. The bears' attempt to gain dominance was a resounding failure. The net position of non-commercial traders (red line) declined in the second half of 2023 and the first half of 2024, while commercial traders (blue line) increased. Currently, professional traders are once again building up long positions.
We still do not see any fundamental factors for strengthening the euro, and technical analysis suggests that the price is in a consolidation zone – in simpler terms, a flat market. On the weekly time frame, it's visible that since December 2022, the pair has been trading between 1.0448 and 1.1274. In other words, we have moved from a 7-month flat market to an 18-month one.
The red and blue lines are diverging at the moment, indicating an increase in long positions for the euro. However, such changes cannot be the basis for long-term conclusions within the flat market. During the last reporting week, the number of longs in the non-commercial group increased by 5,500, while the number of shorts grew by 3,500. Consequently, the net position increased by 2,000. The potential for a decline in the euro currency remains.
Analysis of EUR/USD 1H
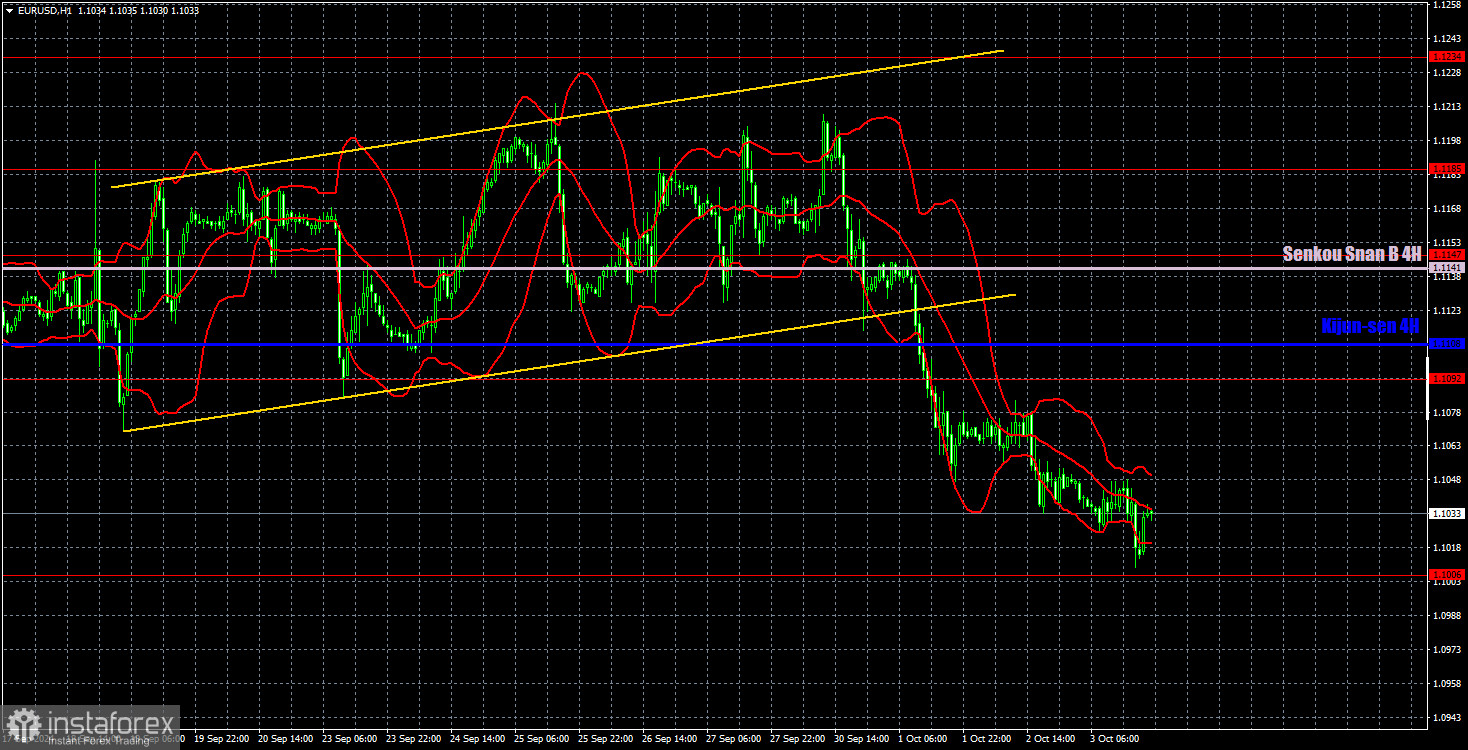
In the hourly time frame, the pair still has a real chance to end the two-year unjustified upward trend. There is no point in discussing the fundamental and macroeconomic reasons for another potential dollar fall—they simply don't exist. Technical analysis has also shifted in favor of a downward direction. Of course, the two-year upward trend may continue for some time due to momentum, but we expect nothing but a decline in the medium term.
For October 4, we highlight the following levels for trading: 1.0658-1.0669, 1.0757, 1.0797, 1.0843, 1.0889, 1.0935, 1.1006, 1.1092, 1.1147, 1.1185, 1.1234, 1.1274, as well as the Senkou Span B line (1.1141) and the Kijun-sen line (1.1108). The Ichimoku indicator lines may shift throughout the day, so this should be considered when identifying trading signals. Remember to set a Stop Loss order at break even if the price moves 15 pips in the intended direction. This will protect against potential losses if the signal turns out to be false.
On Friday, no significant events are scheduled in the Eurozone, but in the U.S., the "reports of the week" — NonFarm Payrolls and the unemployment rate — will be released. These two reports could easily undo all the U.S. dollar's progress this week. However, it's worth noting that these reports have consistently fallen short of forecasts over the past 4-5 months. But that can't last forever, either.
Explanation of Illustrations:
Support and resistance levels: thick red lines where price movement may end. They are not sources of trading signals.
Kijun-sen and Senkou Span B lines: lines of the Ichimoku indicator transferred to the hourly time frame from the 4-hour chart. These are strong lines.
Extreme levels: thin red lines from which the price has previously bounced. They serve as sources of trading signals.
Yellow lines: trend lines, trend channels, and other technical patterns.
Indicator 1 on the COT charts: shows the net position size of each trader category.