signal strength 1 of 5
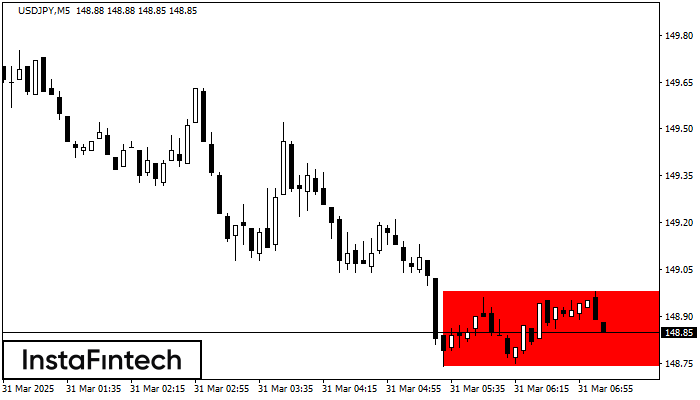
According to the chart of M5, USDJPY formed the Bearish Rectangle. The pattern indicates a trend continuation. The upper border is 148.98, the lower border is 148.74. The signal means that a short position should be opened after fixing a price below the lower border 148.74 of the Bearish Rectangle.
The M5 and M15 time frames may have more false entry points.
See Also
- All
- Double Top
- Flag
- Head and Shoulders
- Pennant
- Rectangle
- Triangle
- Triple top
- All
- #AAPL
- #AMZN
- #Bitcoin
- #EBAY
- #FB
- #GOOG
- #INTC
- #KO
- #MA
- #MCD
- #MSFT
- #NTDOY
- #PEP
- #TSLA
- #TWTR
- AUDCAD
- AUDCHF
- AUDJPY
- AUDUSD
- EURCAD
- EURCHF
- EURGBP
- EURJPY
- EURNZD
- EURRUB
- EURUSD
- GBPAUD
- GBPCHF
- GBPJPY
- GBPUSD
- GOLD
- NZDCAD
- NZDCHF
- NZDJPY
- NZDUSD
- SILVER
- USDCAD
- USDCHF
- USDJPY
- USDRUB
- All
- M5
- M15
- M30
- H1
- D1
- All
- Buy
- Sale
- All
- 1
- 2
- 3
- 4
- 5
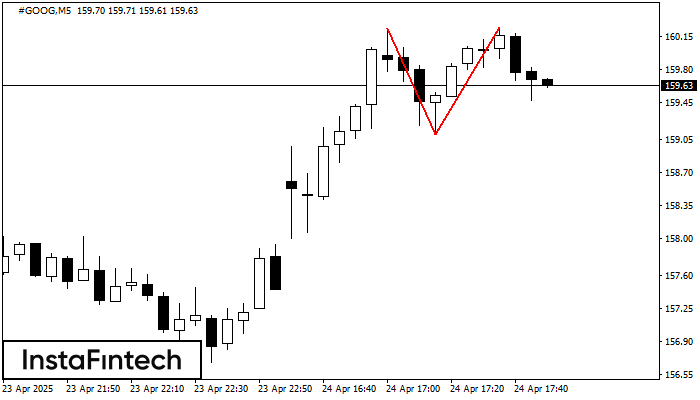
On the chart of #GOOG M5 the Double Top reversal pattern has been formed. Characteristics: the upper boundary 160.25; the lower boundary 159.11; the width of the pattern 114 points
The M5 and M15 time frames may have more false entry points.
Open chart in a new window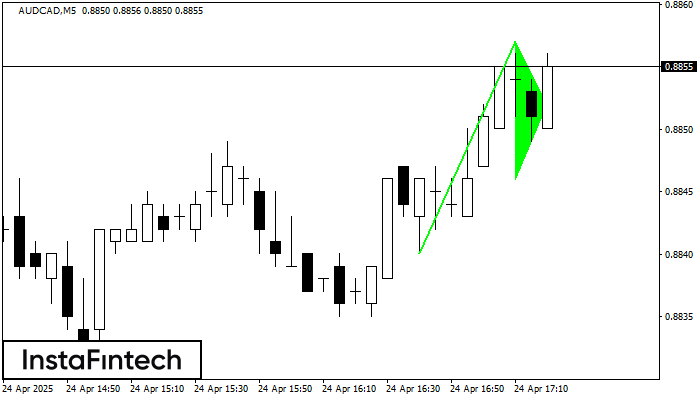
The Bullish pennant signal – Trading instrument AUDCAD M5, continuation pattern. Forecast: it is possible to set up a buy position above the pattern’s high of 0.8857, with the prospect
The M5 and M15 time frames may have more false entry points.
Open chart in a new window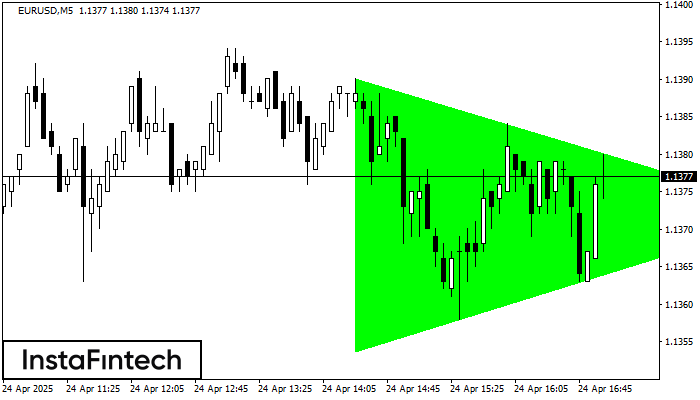
According to the chart of M5, EURUSD formed the Bullish Symmetrical Triangle pattern. Description: This is the pattern of a trend continuation. 1.1390 and 1.1354 are the coordinates
The M5 and M15 time frames may have more false entry points.
Open chart in a new window