signal strength 1 of 5
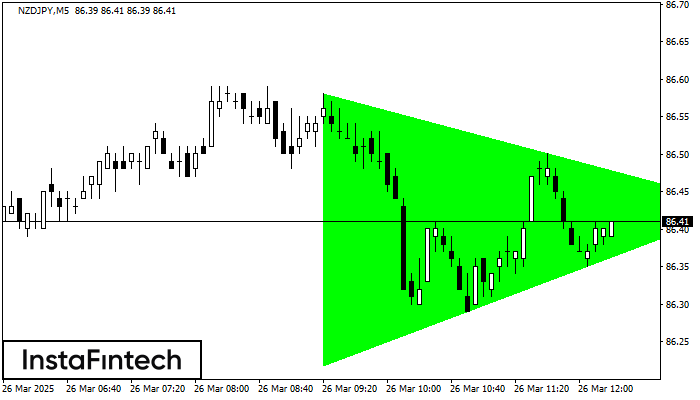
According to the chart of M5, NZDJPY formed the Bullish Symmetrical Triangle pattern, which signals the trend will continue. Description. The upper border of the pattern touches the coordinates 86.58/86.43 whereas the lower border goes across 86.22/86.43. The pattern width is measured on the chart at 36 pips. If the Bullish Symmetrical Triangle pattern is in progress during the upward trend, this indicates the current trend will go on. In case 86.43 is broken, the price could continue its move toward 86.58.
The M5 and M15 time frames may have more false entry points.
- All
- Double Top
- Flag
- Head and Shoulders
- Pennant
- Rectangle
- Triangle
- Triple top
- All
- #AAPL
- #AMZN
- #Bitcoin
- #EBAY
- #FB
- #GOOG
- #INTC
- #KO
- #MA
- #MCD
- #MSFT
- #NTDOY
- #PEP
- #TSLA
- #TWTR
- AUDCAD
- AUDCHF
- AUDJPY
- AUDUSD
- EURCAD
- EURCHF
- EURGBP
- EURJPY
- EURNZD
- EURRUB
- EURUSD
- GBPAUD
- GBPCHF
- GBPJPY
- GBPUSD
- GOLD
- NZDCAD
- NZDCHF
- NZDJPY
- NZDUSD
- SILVER
- USDCAD
- USDCHF
- USDJPY
- USDRUB
- All
- M5
- M15
- M30
- H1
- D1
- All
- Buy
- Sale
- All
- 1
- 2
- 3
- 4
- 5
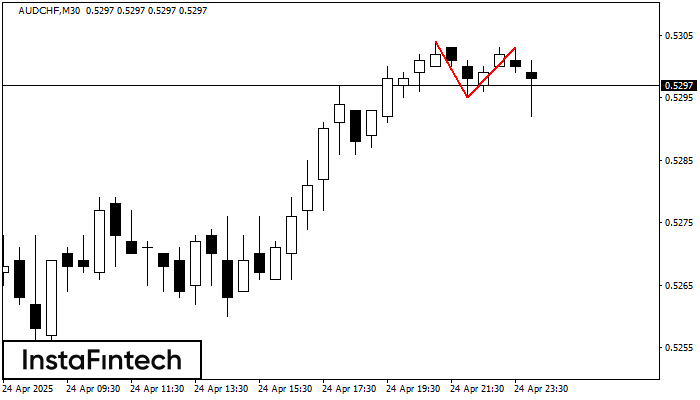
O padrão Topo duplo foi formado em AUDCHF M30. Isso sinaliza que a tendência foi alterada de cima para baixo. Provavelmente, se a base do padrão 0.5295 for quebrada
Open chart in a new window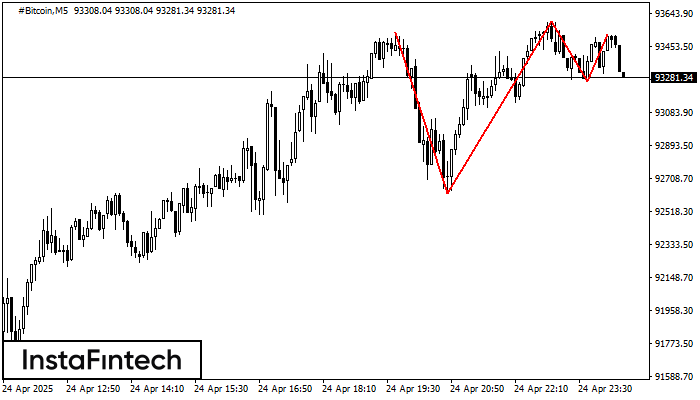
No gráfico do instrumento de negociação #Bitcoin M5, o padrão Topo triplo que sinaliza uma mudança de tendência se formou. É possível que após a formação do terceiro pico
Os intervalos M5 e M15 podem ter mais pontos de entrada falsos.
Open chart in a new window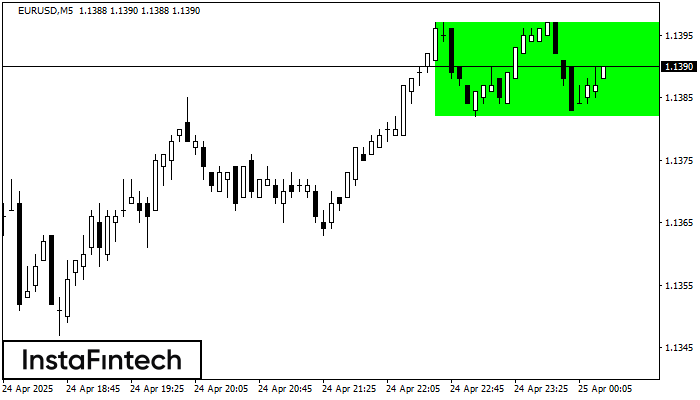
De acordo com o gráfico de M5, EURUSD formou Retângulo de alta. O padrão indica uma continuação da tendência. O limite superior é 1.1397, o limite inferior é 1.1382
Os intervalos M5 e M15 podem ter mais pontos de entrada falsos.
Open chart in a new window