GBP/USD 5-Minute Analysis
The GBP/USD currency pair experienced gains for most of Wednesday, which is somewhat unusual. Earlier in the day, the UK released its inflation report, indicating a decline in December. This suggests that the Bank of England (BoE) may adopt a more dovish stance, forecasting new challenges and potential declines for the British currency. Despite this, the pound continued to rise almost until the evening. After the U.S. inflation report was released, the pound's upward movement persisted, even though the report did not strongly indicate a decline for the dollar. However, by the evening, the market was unable to maintain the rally and shifted to a new wave of selling, which felt more consistent than the previous rise.
We have maintained for a year now that the pound should only decline, and this forecast has proven to be 100% accurate thus far. We still see no reasons for the pound to gain strength in the medium term and expect it to reach at least 1.1800. Both the U.S. and UK inflation reports confirmed a clear trend: in 2025, the Federal Reserve is expected to pursue only minimal easing, while the BoE is anticipated to cut rates at least four times. Additionally, the Fed's easing policy has long been factored in, which casts a bleak outlook for the pound.
Trading signals on Wednesday were not the most favorable. During the European session, the price bounced off the 1.2237 level but only dropped 20 pips before triggering a Stop Loss at breakeven. Subsequently, the price broke above the 1.2237–1.2255 range and the Kijun-sen line, only to fall back below shortly after. The first of these signals was false, but buying during a strong downtrend is generally risky. The second signal may develop further on Thursday and Friday.
COT Report
The latest Commitment of Traders (COT) report for the pound sterling highlights the fluctuating sentiment among commercial traders in recent years. The red and blue lines, representing the net positions of commercial and non-commercial traders, often cross each other and typically hover around the zero mark. Currently, these lines are close together, indicating a roughly equal number of long and short positions.
On the weekly timeframe, the price initially broke below the 1.3154 level and subsequently dropped further, breaching the trendline. This break suggests that the pound's decline is likely to continue in the long term.
According to the latest COT data, the non-commercial group opened 1,600 buy contracts and 100 sell contracts, resulting in a net position increase of 1,500 contracts. However, this does not indicate a positive outlook for the pound.
The fundamental backdrop does not provide any justification for long-term purchases of the pound. Instead, the currency appears to be on the verge of a renewed global downtrend. As a result, the net position may continue to decline, signaling further waning demand for the pound.
GBP/USD 1-Hour Analysis
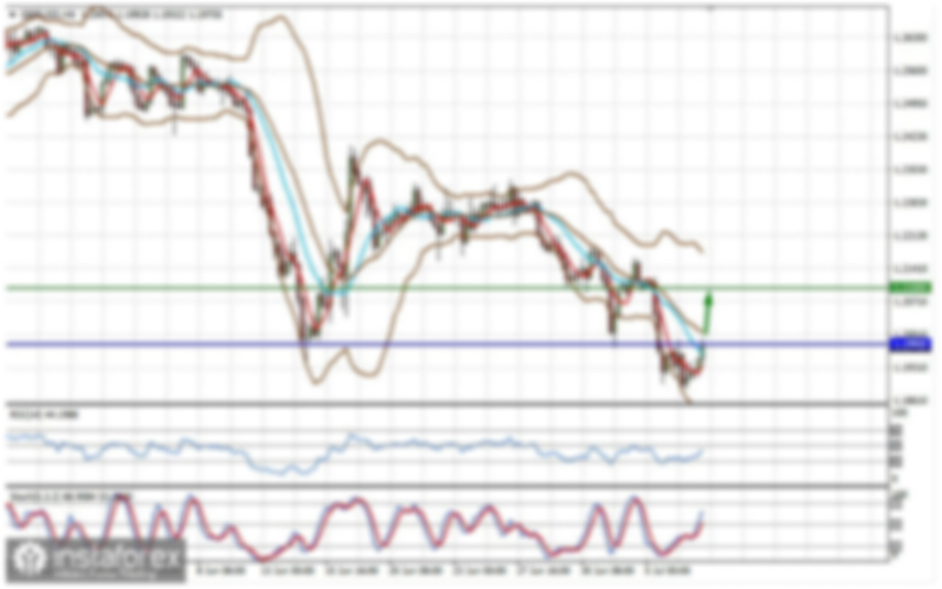
On the hourly chart, the GBP/USD pair is exhibiting a bearish trend. Any upcoming corrective movement is likely to be short-lived, similar to previous corrections. Currently, there are no fundamental reasons to expect a rally in the pound, except for occasional technical corrections that seem to occur repeatedly week after week. In the medium term, we anticipate that the pound will continue to decline.
For January 16, we highlight the following key levels: 1.2052, 1.2109, 1.2237–1.2255, 1.2349, 1.2429–1.2445, 1.2511, 1.2605–1.2620, 1.2691–1.2701, 1.2796–1.2816, and 1.2863. Additionally, the Senkou Span B (1.2421) and Kijun-sen (1.2207) lines can also provide trading signals. It is advisable to set the Stop Loss level to breakeven once the price moves 20 pips in your favor. Keep in mind that the Ishimoku indicator lines may shift throughout the day, which should be considered when determining trading signals.
The UK will release important reports on GDP and industrial production on Thursday; however, these reports are unlikely to change the current market sentiment significantly. In the U.S., retail sales and jobless claims will also be released, but these reports are not expected to have a substantial impact either.
Illustration Explanations:
- Support and Resistance Levels (thick red lines): Thick red lines indicate where movement may come to an end. Please note that these lines are not sources of trading signals.
- Kijun-sen and Senkou Span B Lines: Ichimoku indicator lines transferred from the 4-hour timeframe to the hourly timeframe. These are strong lines.
- Extreme Levels (thin red lines): Thin red lines where the price has previously bounced. These serve as sources of trading signals.
- Yellow Lines: Trendlines, trend channels, or any other technical patterns.
- Indicator 1 on COT Charts: Represents the net position size for each category of traders.