empty
30.03.2023 01:28 PM
Technical analysis of BTC/USD for March 30, 2023

This image is no longer relevant

Trading BTC/USD :

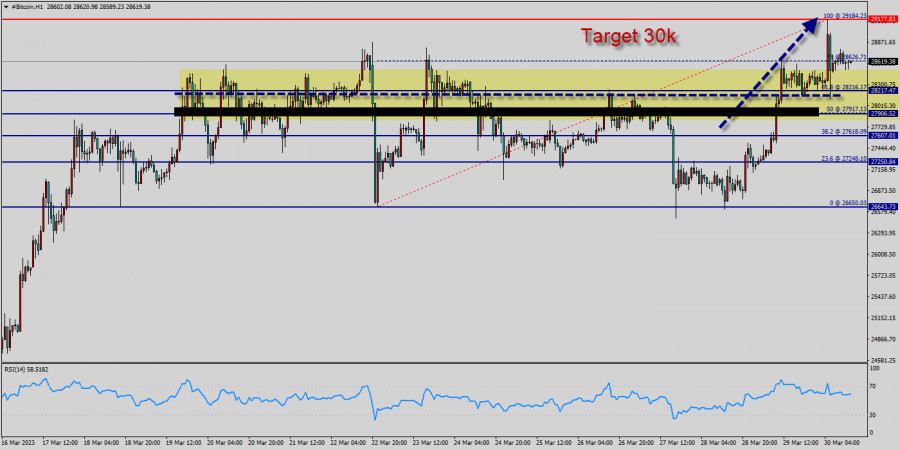
Bitcoin The bullish trend is currently very strong for BITCOIN - BTC/USD. As long as the price remains above the support at 28k USD, you could try to take advantage of the bullish rally in short term. The first bullish objective is located at 28,626 USD (this price is coincided with the ratio 78% of Fibonacci retracement levels).

The bullish momentum would be revived by a break in this resistance. Closing above the pivot point (28k USD) could assure that BTC/USD will move higher towards cooling new highs. The bulls must break through 29k USD in order to resume the up trend. Buyers would then use the next resistance located at 29,184 USD as an objective (this price is coincided with the ratio 100% of Fibonacci retracement levels - the double top - te last bullish wave on the hourly chart).

Crossing it would then enable buyers to target 29k USD. Be careful, given the powerful bullish rally underway, excesses could lead to a short-term rebound. Bitcoin's price has been consolidating between the 28k USD and 30k USD over the last few weeks, following a massive rising from the 28k USD mark.

So far, the price has been supported by the 28k USD - 27k USD range. If this is the case, remember that trading against the trend may be riskier. It would seem more appropriate to wait for a signal indicating reversal of the trend.

However, considering the current price action and the third rejection from this area, a run to the 29k USD support level and the 50-day moving average seems more likely. A bullish breakout from these levels would initiate a rally towards the 29k USD - 30k USD supply zone – a key level to which the price's reaction would determine the mid-term trend of the market.

In the very short term, the general bearish sentiment is confirmed by technical indicators. Nevertheless, a small upwards rebound in the very short term could occur in case of excessive bearish movements.

After finding bids reach to 29k USD, bitcoin price recovered above 26k USD, 27k USD and 28k USD. Initial Bitcoin resistance lies near the 28,626 USD level (78% of Fibonacci retracement levels).

A decent breakout and follow-up move above 28,626 USD could open the gate for a push towards the 29k USD level. The main resistance remains near the area of 29k USD - 30k USD.

Also it should be noted that Bitcoin and cryptocurrencies unite as the bears lose their momentum. The market is indicating a bullish opportunity above the above-mentioned support levels, for that the bullish outlook remains the same as long as the 100 EMA is headed to the upside.

Trading BTC/USD :

An uptrend will start as soon, as the market rises above resistance level 28k USD, which will be followed by moving up to resistance level 29k USD. Further close above the high end may cause a rally towards 30k USD. Nonetheless, the weekly resistance level and zone should be considered.

Select timeframe
5
min
15
min
30
min
1
hour
4
hours
1
day
1
week
Earn on cryptocurrency rate changes with InstaForex
Download MetaTrader 4 and open your first trade
  • Grand Choice
    Contest by
    InstaForex
    InstaForex always strives to help you
    fulfill your biggest dreams.
    JOIN CONTEST

Recommended Stories

Forecast for GBP/USD on April 15, 2025

On the hourly chart, the GBP/USD pair continued rising on Monday and secured a position above the 1.3139 level. Thus, the upward movement may continue toward the next Fibonacci corrective

Samir Klishi 11:59 2025-04-15 UTC+2

Forecast for EUR/USD on April 15, 2025

On Monday, the EUR/USD pair continued to rise but returned by the end of the day to the 261.8% Fibonacci retracement level at 1.1318. A double rebound from this level

Samir Klishi 11:55 2025-04-15 UTC+2

Forex forecast 15/04/2025: EUR/USD, GBP/USD, USD/JPY, USD/CAD and Bitcoin

Useful links: My other articles are available in this section InstaForex course for beginners Popular Analytics Open trading account Important: The begginers in forex trading need to be very careful

Sebastian Seliga 09:44 2025-04-15 UTC+2

Forex forecast 14/04/2025: EUR/USD, GBP/USD, USD/JPY, Gold and Bitcoin

Useful links: My other articles are available in this section InstaForex course for beginners Popular Analytics Open trading account Important: The begginers in forex trading need to be very careful

Sebastian Seliga 08:54 2025-04-15 UTC+2

Technical Analysis of Intraday Price Movement of EUR/JPY Cross Currency Pairs, Tuesday April 15, 2025.

With the appearance of Divergence between the price movement of the EUR/JPY cross currency pair with the Stochastic Oscillator indicator also followed by the presence of the Bullish 123 pattern

Arief Makmur 07:13 2025-04-15 UTC+2

Technical Analysis of Intraday Price Movement of GBP/AUD Cross Currency Pairs, Tuesday April 15, 2025.

On the 4-hour chart, the GBP/AUD cross currency pair appears to be moving below its EMA (21) and the Stochastic Oscillator indicator is in a Crossing SELL condition

Arief Makmur 07:13 2025-04-15 UTC+2

Trading Signals for GOLD (XAU/USD) for April 14-17, 2024: sell below $3,224 (+1/8 Murray - 21 SMA)

Our trading plan for the coming hours is to sell gold below 3,224, with targets at 3,203 and 3,156. We should be alert to any technical rebound, as the outlook

Dimitrios Zappas 15:59 2025-04-14 UTC+2

Forecast for EUR/USD on April 14, 2025

On Friday, the EUR/USD pair continued to rise but pulled back in the second half of the day. The decline (i.e., dollar strengthening) was short-lived

Samir Klishi 12:28 2025-04-14 UTC+2

Forecast for GBP/USD on April 14, 2025

On the hourly chart, the GBP/USD pair continued its upward movement on Friday and today is on track to reach the 1.3151 level. A bounce from this level will favor

Samir Klishi 12:25 2025-04-14 UTC+2

Technical Analysis of Intraday Price Movement of Crude Oil Commodity Instrument, Monday April 24, 2025.

On the 4-hour chart of the Crude Oil commodity instrument, the Inverted Head & Shoulders pattern and Bullish Pattern 123 and Divergence between the #CL price movement and the Stochastic

Arief Makmur 07:19 2025-04-14 UTC+2
Can't speak right now?
Ask your question in the chat.
Widget callback
 

Dear visitor,

Your IP address shows that you are currently located in the USA. If you are a resident of the United States, you are prohibited from using the services of InstaFintech Group including online trading, online transfers, deposit/withdrawal of funds, etc.

If you think you are seeing this message by mistake and your location is not the US, kindly proceed to the website. Otherwise, you must leave the website in order to comply with government restrictions.

Why does your IP address show your location as the USA?

  • - you are using a VPN provided by a hosting company based in the United States;
  • - your IP does not have proper WHOIS records;
  • - an error occurred in the WHOIS geolocation database.

Please confirm whether you are a US resident or not by clicking the relevant button below. If you choose the wrong option, being a US resident, you will not be able to open an account with InstaForex anyway.

We are sorry for any inconvenience caused by this message.