signal strength 1 of 5

The technical pattern called Head and Shoulders has appeared on the chart of AUDJPY M5. There are weighty reasons to suggest that the price will surpass the Neckline 94.62/94.62 after the right shoulder has been formed. So, the trend is set to change with the price heading for 94.47.
The M5 and M15 time frames may have more false entry points.
See Also
- All
- Double Top
- Flag
- Head and Shoulders
- Pennant
- Rectangle
- Triangle
- Triple top
- All
- #AAPL
- #AMZN
- #Bitcoin
- #EBAY
- #FB
- #GOOG
- #INTC
- #KO
- #MA
- #MCD
- #MSFT
- #NTDOY
- #PEP
- #TSLA
- #TWTR
- AUDCAD
- AUDCHF
- AUDJPY
- AUDUSD
- EURCAD
- EURCHF
- EURGBP
- EURJPY
- EURNZD
- EURRUB
- EURUSD
- GBPAUD
- GBPCHF
- GBPJPY
- GBPUSD
- GOLD
- NZDCAD
- NZDCHF
- NZDJPY
- NZDUSD
- SILVER
- USDCAD
- USDCHF
- USDJPY
- USDRUB
- All
- M5
- M15
- M30
- H1
- D1
- All
- Buy
- Sale
- All
- 1
- 2
- 3
- 4
- 5

The Bearish pennant pattern has formed on the GBPAUD M5 chart. This pattern type is characterized by a slight slowdown after which the price will move in the direction
The M5 and M15 time frames may have more false entry points.
Open chart in a new window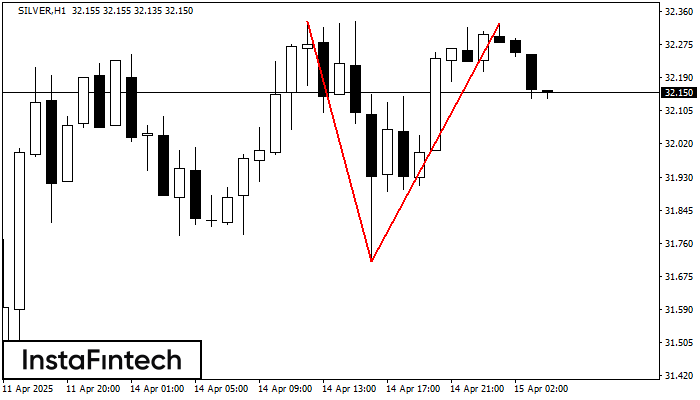
On the chart of SILVER H1 the Double Top reversal pattern has been formed. Characteristics: the upper boundary 32.33; the lower boundary 31.71; the width of the pattern 615 points
Open chart in a new window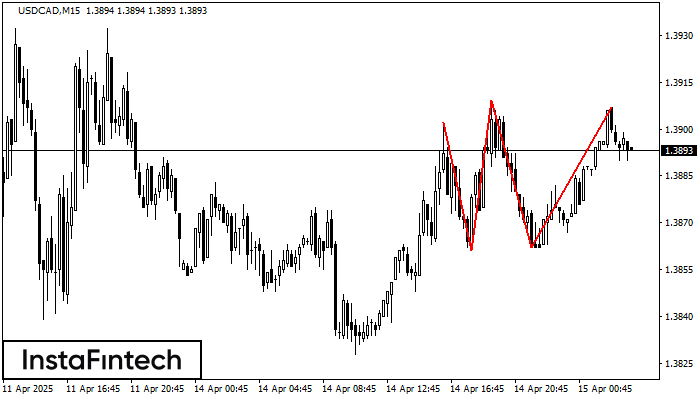
The Triple Top pattern has formed on the chart of the USDCAD M15 trading instrument. It is a reversal pattern featuring the following characteristics: resistance level -5, support level -1
The M5 and M15 time frames may have more false entry points.
Open chart in a new window