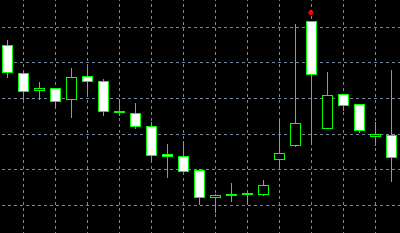
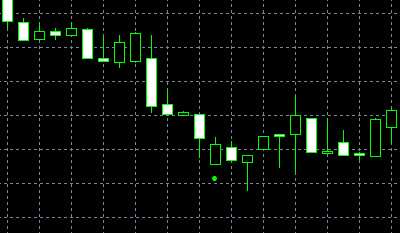
The Meeting Lines pattern is formed when candlesticks of opposite colors have the same closing price.
Bullish Meeting Lines
This pattern usually occurs on a chart when prices are heading lower in a downtrend. The first day of this pattern is characterized by a long black candlestick. The next day’s open price falls sharply, strongly favoring the bearish scenario. The Bullish Meeting Lines pattern is similar to the concept of the Bullish Piercing Line formation, the only difference being the price rebound level during the second day.
The Meeting Lines only rise up to the first day’s closing price while the Piercing Line’s second day goes beyond the midpoint of the first day’s candlestick body. However, the Piercing Line is considered to be more significant than the Bullish Meeting Lines. One should avoid confusing this chart candlestick pattern with the On Neck Line formation.
Bearish Meeting Lines
The Meeting Lines pattern also bears a close resemblance to the Dark Cloud Cover formation. The Bearish Meeting Lines open at a new high and close at the previous day’s closing price, while the Dark Cloud Cover slides below the midpoint.
How to recognize this pattern?
1. The bodies of both lines are located in the direction of the current trend.
2. The first body’s color always reflects the trend: the black color indicates a downtrend while the white color can be seen in an uptrend.
3. The second candlestick is of the opposite color.
4. The closing prices of both days are the same.
5. Both days should be long.
Possible scenarios and pattern psychology behind Meeting Lines
A downtrend dominates the market when a long black day is forming, reinforcing the bearish scenario within this day. The next day opens with a downward gap. Throughout the entire day, prices are climbing to close at the same level as the previous day. In this case, the chances of a trend reversal are very high. If the third day opens even higher, a confirmation will be received.
Pattern flexibility
This pattern is comprised of two long candlesticks. However, in most cases the second day is shorter than the first day. This does not seem to affect the pattern’s reliability as a confirmation will still be needed. It is best if each day represents a closing marubozu.
Pattern breakdown
The Meeting Lines formation breaks down into a single candlestick that does not offer a confirmation. This single candlestick looks like the first candlestick pattern but its shadow extends in the direction of the second day. The breakdown neither confirms the pattern nor indicates a lack of its strength.
Related patterns
The opposite formation to the Meeting Lines is the Separating Lines, which represents a continuation pattern. Besides, if the second candle body penetrates the first one, this pattern may evolve into the Dark Cloud Cover or the Piercing Line.


