GBP/USD 5-Minute Analysis
The GBP/USD currency pair experienced a significant rally on Monday, largely driven by events related to Donald Trump from the previous Friday. For traders who believed that macroeconomic data played a pivotal role in the euro's rally, the GBP/USD performance serves as a counterexample. There were no major news events in the UK on Monday, except for the second estimate of the manufacturing PMI. By the time the weak ISM index was released in the U.S., the GBP/USD pair had already surged by 115 pips. Therefore, if macroeconomic data had any influence, it was minimal.
However, events surrounding Trump completely altered the technical outlook on the hourly chart. Monday showcased a clear example of how fundamental events can overshadow technical setups. The pound had been on the rise for weeks, breaking through two ascending trendlines and appearing ready for a potential downturn. Yet, Trump's related events triggered a collapse in the dollar, causing GBP/USD to climb higher once again. Predicting how much longer the pair will continue to rise is challenging, especially with another significant announcement from Trump scheduled for today. Currently, there is no clear trendline, and market movements seem to be driven by emotions.
The trading signals for the pound were not much more promising than those for the euro. Initially, the price bounced off the 1.2605-1.2620 range but struggled to drop even 20 pips. It later broke through the 1.2605-1.2620 area and the Kijun-sen line, but this breakout lacked justification from macroeconomic data. Although long positions could theoretically have been initiated after the Kijun-sen breakout, Monday's trading movements were unpredictable, and the pound's rally felt irrational. Ultimately, the pair also surpassed the 1.2691-1.2701 zone.
COT Report
COT reports for the British pound indicate that commercial traders' sentiment has been fluctuating significantly in recent years. The red and blue lines, which represent the net positions of commercial and non-commercial traders, often intersect and generally hover near the zero mark. Currently, they are close to each other, suggesting a roughly equal number of long and short positions.
On the weekly timeframe, the price initially broke through the 1.3154 level and subsequently declined to the trend line, which was also breached. This break of the trend line implies that the pound's decline is likely to continue. However, there was a rebound from the previous local low on the weekly chart, which may indicate a range-bound movement.
The latest COT report on the British pound shows that the non-commercial group opened 500 BUY contracts and closed 4,500 SELL contracts. As a result, the net position of non-commercial traders increased by 5,000 contracts over the week, though this change does not significantly bolster the pound.
The fundamental backdrop still does not justify long-term purchases of the pound, and the currency remains at risk of continuing its long-term downtrend. Therefore, the net position may decline, signaling reduced demand for the British pound.
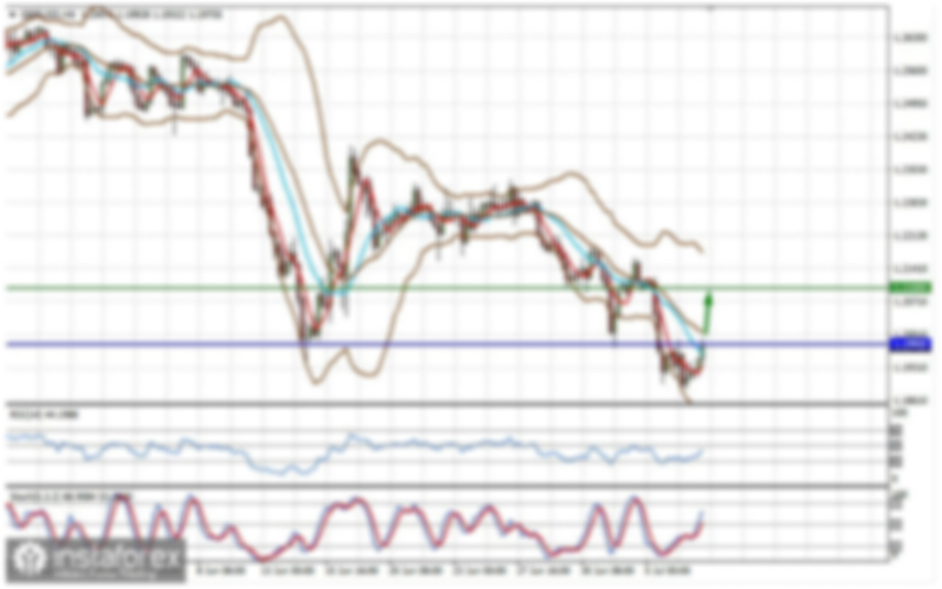
GBP/USD 1-Hour Analysis
On the hourly chart, GBP/USD ended the uptrend forming for weeks, only to start a new one immediately. This may not be the last trend shift within the broader corrective pattern on the daily timeframe. However, we still don't see any fundamental reasons for a long-term pound rally. Donald Trump appears to be the sole factor benefiting the British currency. His unorthodox approach suggests he may be trying to weaken the dollar—something he has long wanted to achieve as U.S. president.
For March 4, we highlight the following key levels: 1.2237-1.2255, 1.2331-1.2349, 1.2429-1.2445, 1.2511, 1.2605-1.2620, 1.2691-1.2701, 1.2796-1.2816, 1.2981-1.2987. The Senkou Span B (1.2570) and Kijun-sen (1.2636) lines could also serve as signal sources. The Stop Loss should be placed at breakeven when the price moves 20 pips in the right direction. The Ichimoku indicator lines may shift throughout the day, so traders should consider this when identifying signals.
On Tuesday, neither the UK nor the U.S. has any major economic events scheduled—except for another speech by Donald Trump. So, the market could be in for anything: a 100-150 pip crash or another dollar collapse triggered by Trump's remarks. At this point, nothing should come as a surprise.
Illustration Explanations:
- Support and Resistance Levels (thick red lines): Thick red lines indicate where movement may come to an end. Please note that these lines are not sources of trading signals.
- Kijun-sen and Senkou Span B Lines: Ichimoku indicator lines transferred from the 4-hour timeframe to the hourly timeframe. These are strong lines.
- Extreme Levels (thin red lines): Thin red lines where the price has previously bounced. These serve as sources of trading signals.
- Yellow Lines: Trendlines, trend channels, or any other technical patterns.
- Indicator 1 on COT Charts: Represents the net position size for each category of traders.