signal strength 1 of 5
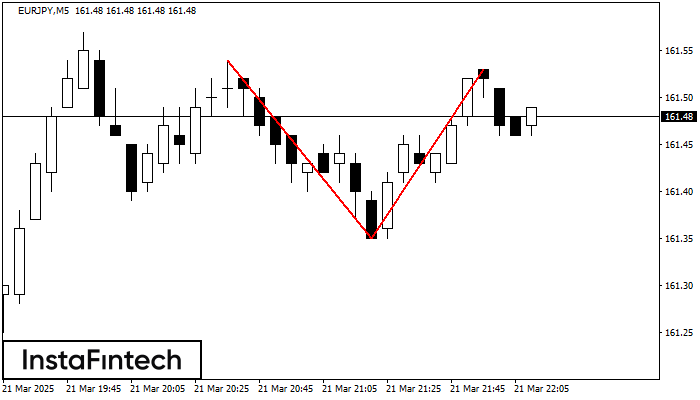
The Double Top reversal pattern has been formed on EURJPY M5. Characteristics: the upper boundary 161.54; the lower boundary 161.35; the width of the pattern is 18 points. Sell trades are better to be opened below the lower boundary 161.35 with a possible movements towards the 161.20 level.
The M5 and M15 time frames may have more false entry points.
See Also
- All
- Double Top
- Flag
- Head and Shoulders
- Pennant
- Rectangle
- Triangle
- Triple top
- All
- #AAPL
- #AMZN
- #Bitcoin
- #EBAY
- #FB
- #GOOG
- #INTC
- #KO
- #MA
- #MCD
- #MSFT
- #NTDOY
- #PEP
- #TSLA
- #TWTR
- AUDCAD
- AUDCHF
- AUDJPY
- AUDUSD
- EURCAD
- EURCHF
- EURGBP
- EURJPY
- EURNZD
- EURRUB
- EURUSD
- GBPAUD
- GBPCHF
- GBPJPY
- GBPUSD
- GOLD
- NZDCAD
- NZDCHF
- NZDJPY
- NZDUSD
- SILVER
- USDCAD
- USDCHF
- USDJPY
- USDRUB
- All
- M5
- M15
- M30
- H1
- D1
- All
- Buy
- Sale
- All
- 1
- 2
- 3
- 4
- 5

According to the chart of M5, NZDUSD formed the Inverse Head and Shoulder pattern. The Head’s top is set at 0.5723 while the median line of the Neck is found
The M5 and M15 time frames may have more false entry points.
Open chart in a new window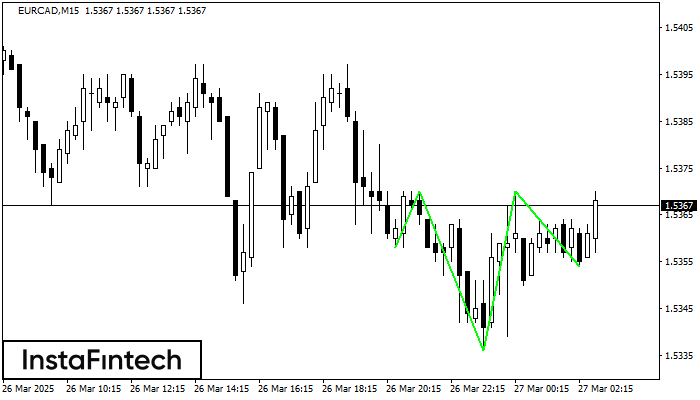
According to the chart of M15, EURCAD formed the Inverse Head and Shoulder pattern. The Head’s top is set at 1.5370 while the median line of the Neck is found
The M5 and M15 time frames may have more false entry points.
Open chart in a new window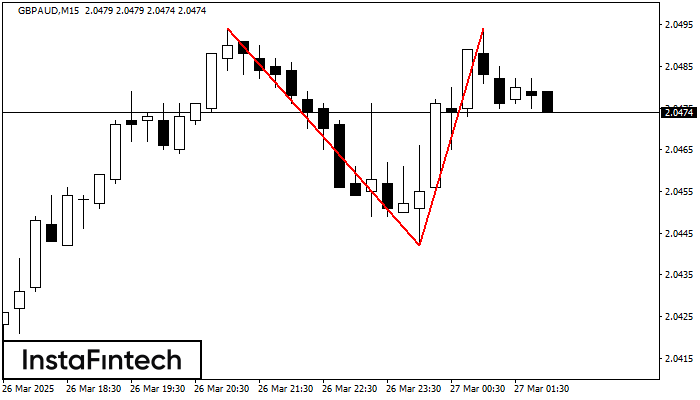
The Double Top pattern has been formed on GBPAUD M15. It signals that the trend has been changed from upwards to downwards. Probably, if the base of the pattern 2.0442
The M5 and M15 time frames may have more false entry points.
Open chart in a new window