Actual patterns
Patterns are graphical models which are formed in the chart by the price. According to one of the technical analysis postulates, history (price movement) repeats itself. It means that the price movements are often similar in the same situations which makes it possible to predict the further development of the situation with a high probability.
Actual Patterns
- All
- Double Top
- Flag
- Head and Shoulders
- Pennant
- Rectangle
- Triangle
- Triple top
- All
- #AAPL
- #AMZN
- #Bitcoin
- #EBAY
- #FB
- #GOOG
- #INTC
- #KO
- #MA
- #MCD
- #MSFT
- #NTDOY
- #PEP
- #TSLA
- #TWTR
- AUDCAD
- AUDCHF
- AUDJPY
- AUDUSD
- EURCAD
- EURCHF
- EURGBP
- EURJPY
- EURNZD
- EURRUB
- EURUSD
- GBPAUD
- GBPCHF
- GBPJPY
- GBPUSD
- GOLD
- NZDCAD
- NZDCHF
- NZDJPY
- NZDUSD
- SILVER
- USDCAD
- USDCHF
- USDJPY
- USDRUB
- All
- M5
- M15
- M30
- H1
- D1
- All
- Buy
- Sale
- All
- 1
- 2
- 3
- 4
- 5
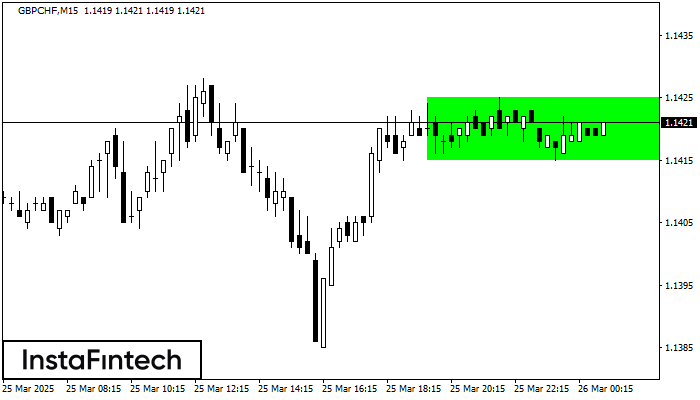
According to the chart of M15, GBPCHF formed the Bullish Rectangle. This type of a pattern indicates a trend continuation. It consists of two levels: resistance 1.1425 and support 1.1415
The M5 and M15 time frames may have more false entry points.
Open chart in a new window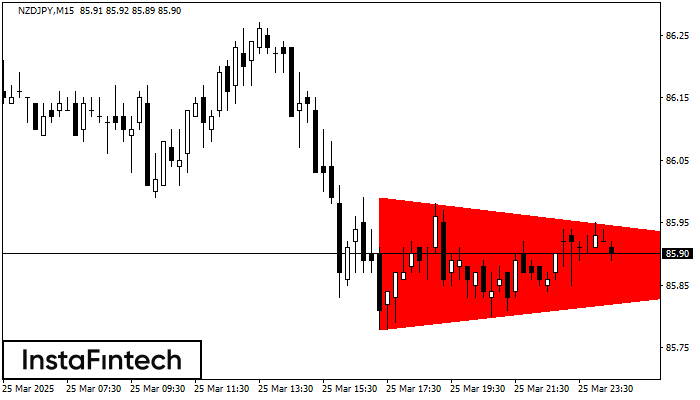
According to the chart of M15, NZDJPY formed the Bearish Symmetrical Triangle pattern. Description: The lower border is 85.78/85.88 and upper border is 85.99/85.88. The pattern width is measured
The M5 and M15 time frames may have more false entry points.
Open chart in a new window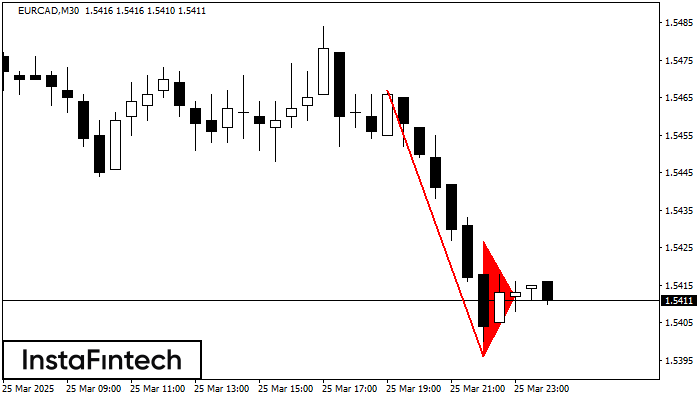
The Bearish pennant pattern has formed on the EURCAD M30 chart. The pattern signals continuation of the downtrend in case the pennant’s low of 1.5396 is broken through. Recommendations: Place
Open chart in a new window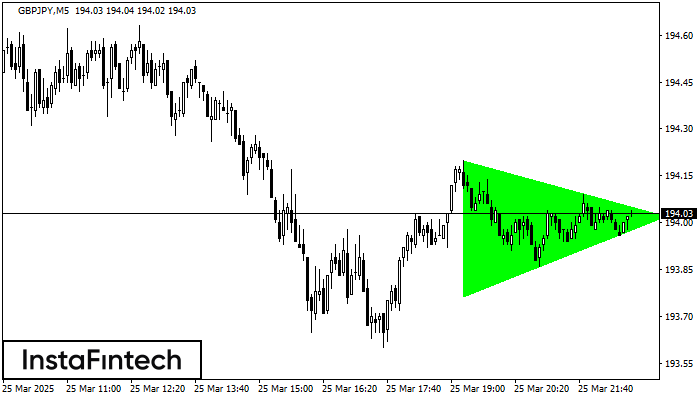
According to the chart of M5, GBPJPY formed the Bullish Symmetrical Triangle pattern, which signals the trend will continue. Description. The upper border of the pattern touches the coordinates 194.20/194.02
The M5 and M15 time frames may have more false entry points.
Open chart in a new window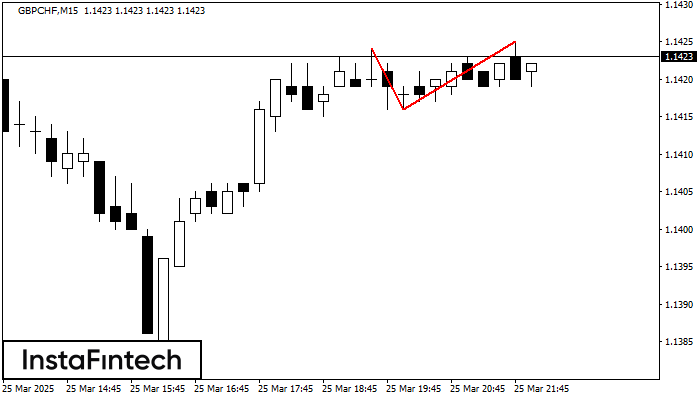
On the chart of GBPCHF M15 the Double Top reversal pattern has been formed. Characteristics: the upper boundary 1.1425; the lower boundary 1.1416; the width of the pattern 9 points
The M5 and M15 time frames may have more false entry points.
Open chart in a new window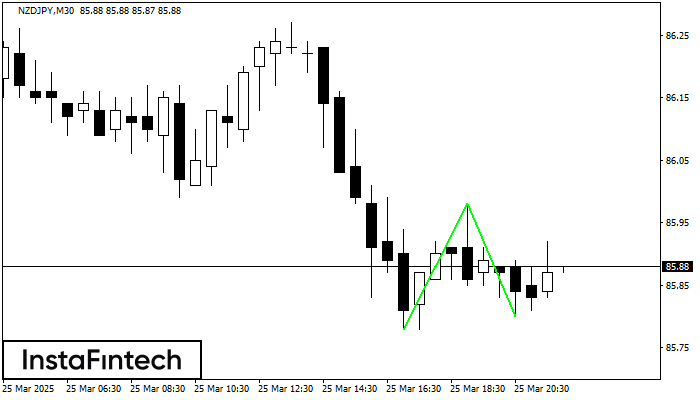
The Double Bottom pattern has been formed on NZDJPY M30. Characteristics: the support level 85.78; the resistance level 85.98; the width of the pattern 20 points. If the resistance level
Open chart in a new window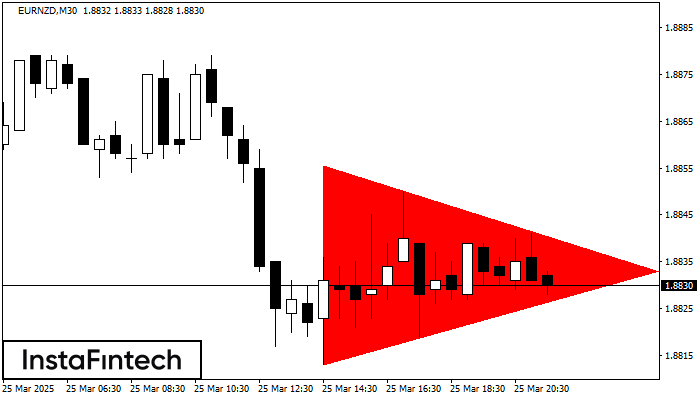
According to the chart of M30, EURNZD formed the Bearish Symmetrical Triangle pattern. This pattern signals a further downward trend in case the lower border 1.8813 is breached. Here
Open chart in a new window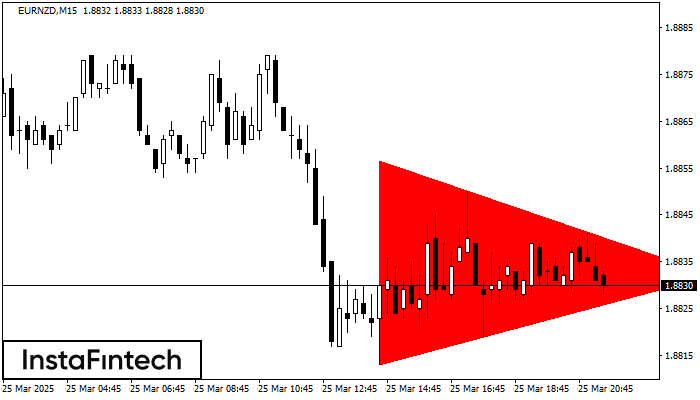
According to the chart of M15, EURNZD formed the Bearish Symmetrical Triangle pattern. Trading recommendations: A breach of the lower border 1.8813 is likely to encourage a continuation
The M5 and M15 time frames may have more false entry points.
Open chart in a new window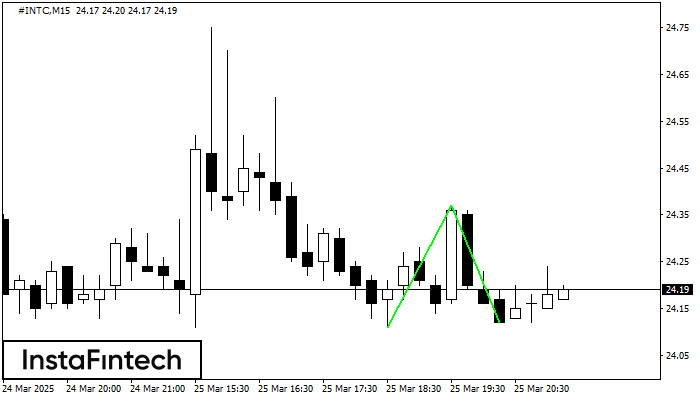
The Double Bottom pattern has been formed on #INTC M15; the upper boundary is 24.37; the lower boundary is 24.12. The width of the pattern is 26 points. In case
The M5 and M15 time frames may have more false entry points.
Open chart in a new window