signal strength 2 of 5
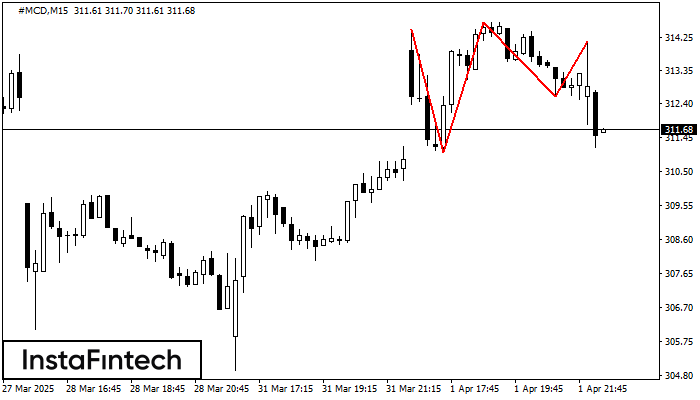
The Triple Top pattern has formed on the chart of the #MCD M15. Features of the pattern: borders have an ascending angle; the lower line of the pattern has the coordinates 311.03/312.60 with the upper limit 314.48/314.14; the projection of the width is 345 points. The formation of the Triple Top figure most likely indicates a change in the trend from upward to downward. This means that in the event of a breakdown of the support level of 311.03, the price is most likely to continue the downward movement.
The M5 and M15 time frames may have more false entry points.
انظر أيضا
- All
- Double Top
- Flag
- Head and Shoulders
- Pennant
- Rectangle
- Triangle
- Triple top
- All
- #AAPL
- #AMZN
- #Bitcoin
- #EBAY
- #FB
- #GOOG
- #INTC
- #KO
- #MA
- #MCD
- #MSFT
- #NTDOY
- #PEP
- #TSLA
- #TWTR
- AUDCAD
- AUDCHF
- AUDJPY
- AUDUSD
- EURCAD
- EURCHF
- EURGBP
- EURJPY
- EURNZD
- EURRUB
- EURUSD
- GBPAUD
- GBPCHF
- GBPJPY
- GBPUSD
- GOLD
- NZDCAD
- NZDCHF
- NZDJPY
- NZDUSD
- SILVER
- USDCAD
- USDCHF
- USDJPY
- USDRUB
- All
- M5
- M15
- M30
- H1
- D1
- All
- Buy
- Sale
- All
- 1
- 2
- 3
- 4
- 5
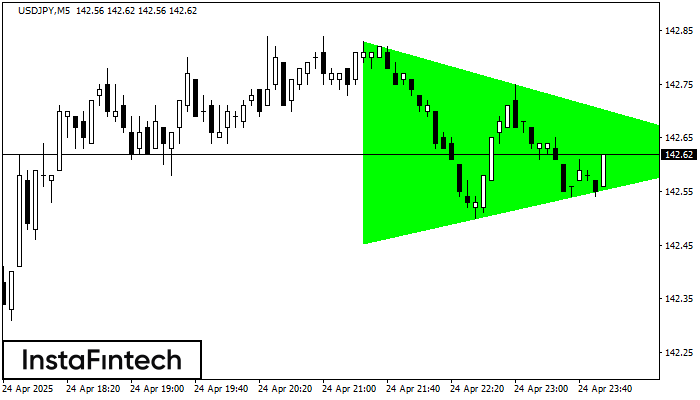
De acordo com o gráfico de M5, USDJPY formou o padrão de Triângulo Simétrico de Alta. O limite inferior do padrão toca as coordenadas 142.45/142.62 enquanto o limite superior cruza
Os intervalos M5 e M15 podem ter mais pontos de entrada falsos.
Open chart in a new window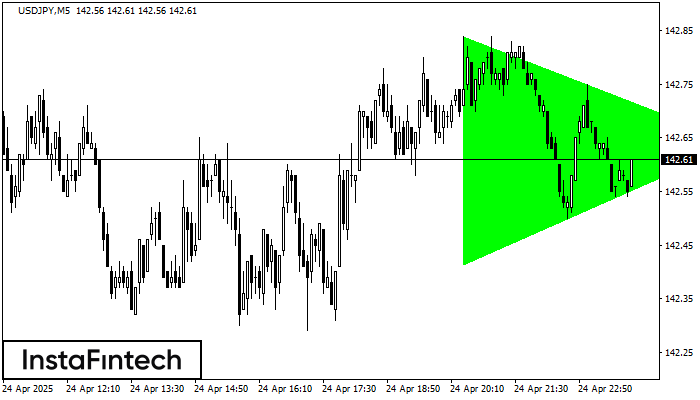
De acordo com o gráfico de M5, USDJPY formou o padrão de Triângulo Simétrico de Alta. O limite inferior do padrão toca as coordenadas 142.41/142.64 enquanto o limite superior cruza
Os intervalos M5 e M15 podem ter mais pontos de entrada falsos.
Open chart in a new window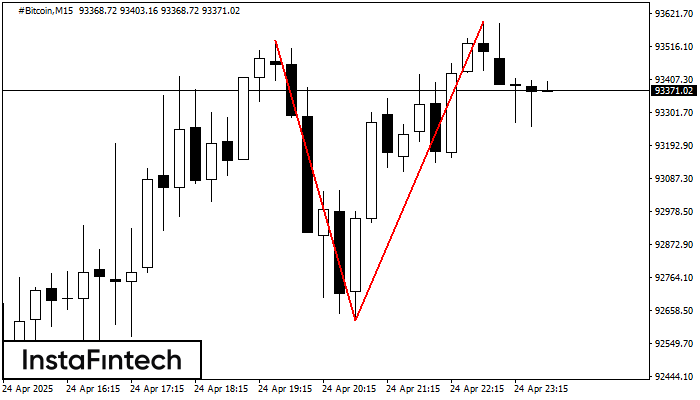
O padrão Topo duplo foi formado em #Bitcoin M15. Isso sinaliza que a tendência foi alterada de cima para baixo. Provavelmente, se a base do padrão 92625.25 for quebrada
Os intervalos M5 e M15 podem ter mais pontos de entrada falsos.
Open chart in a new window